Videos
Exercises for Section 9.2
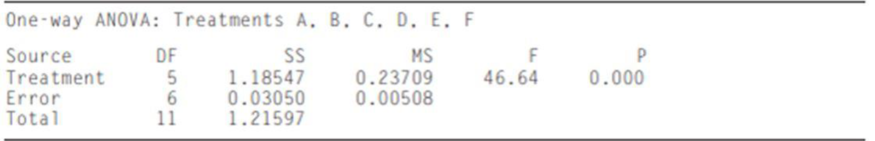
1. The article “Organic Recycling for Soil Quality Conservation in a Sub-Tropical Plateau Region” (K. Chakrabarti, B. Sarkar, et al., J. Agronomy and Crop Science. 2000:137–142) reports an experiment in which soil specimens were treated with six different treatments, with two replicates per treatment, and the acid phosphate activity (in μmol p-nitrophenol released per gram of oven-dry soil per hour) was recorded. An ANOVA table for a one-way ANOVA follows.
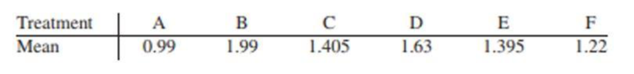
The treatment means were
- a. Can you conclude that there are differences in acid phosphate activity among the treatments?
- b. Use the Tukey–Kramer method to determine which pairs of treatment means, if any. are different at the 5% level.
- c. Use the Bonferroni method to determine which pairs of treatment means, if any, are different at the 5% level.
- d. Which method is more powerful in this case, the Tukey–Kramer method or the Bonferroni method?
- e. The experimenter notices that treatment A had the smallest sample
mean , while treatment B had the largest. Of the Fisher LSD method, the Bonferroni method, and the Tukey-Kramer method, which, if any, can be used to test the hypothesis that these two treatment means are equal?

Trending nowThis is a popular solution!

Chapter 9 Solutions
Statistics for Engineers and Scientists - With Access
Additional Math Textbook Solutions
Basic Business Statistics, Student Value Edition (13th Edition)
Statistics Through Applications
Statistics: The Art and Science of Learning from Data (4th Edition)
Elementary Statistics Using The Ti-83/84 Plus Calculator, Books A La Carte Edition (5th Edition)
Elementary Statistics ( 3rd International Edition ) Isbn:9781260092561
Stats: Modeling the World Nasta Edition Grades 9-12


- The Turbine Oil Oxidation Test (TOST) and the Rotating Bomb Oxidation Test (RBOT) are two different procedures for evaluating the oxidation stability of steam turbine oils. An article reported the accompanying observations on x = TOST time (hr) and y = RBOT time (min) for 12 oil specimens. TOST 4200 3600 3750 3650 4050 2770 RBOT 370 345 375 315 350 205 TOST 4870 4525 3450 2700 3750 3325 RBOT 400 380 285 220 345 290 (a) Calculate the value of the sample correlation coefficient. (Round your answer to four decimal places.) r = Carry out a test of hypotheses to decide whether RBOT Time and TOST time are linearly related. (Use ? = 0.05.) Calculate the test statistic and determine the P-value. (Round your test statistic to two decimal places and your P-value to three decimal places.) t = P-value =arrow_forward5. A consumer buying cooperative tested the effective heating area of 20 different electric space heaters with different wattages. Here are the results. Heater Wattage Area 1 750 291 2 1,750 83 3 1,250 215 4 1,750 209 5 1,500 295 6 750 153 7 1,000 40 8 750 166 9 1,250 115 10 1,250 146 11 750 113 12 1,000 56 13 1,750 284 14 1,000 45 15 750 82 16 1,250 175 17 750 150 18 1,500 231 19 1,000 87 20 750 52 Click here for the Excel Data FileRequired:a. Compute the correlation between the wattage and heating area. Is there a direct or an indirect relationship? (Round your answer to 4 decimal places.) b. Conduct a test of hypothesis to determine if it is reasonable that the coefficient is greater than zero. Use the 0.050 significance level. (Round intermediate calculations and final answer to 3 decimal places.)H0: ρ ≤ 0; H1: ρ > 0 Reject H0 if t > 1.734…arrow_forwardQUESTION 3 The Research Unit for Cecilion Supermart conducted an experiment to estimate the strength of thecarrier bag from the starch-based biofilms made from two different jicamas (sengkuang) of type Aand type B. However, the researcher claims that jicama type A produces more strength comparedto type B. To support this claim, 10kg weight item was put into 100 carrier bags made from jicamatype A and 200 carrier bags made from jicama type B were randomly selected. As a result, 8 bagsfrom jicama type A burst while 12 bags from jicama type B burst. Calculate a 95% confidenceinterval for the difference in true proportion of the carrier bags which burst between jicama type Aand type B. Give comment on the parameter estimate.arrow_forward
- Here is a dataset containing plant growth measurements of plants grown in solutions of commonly-found chemicals in roadway runoff.Phragmites australis, a fast-growing non-native grass common to roadsides and disturbed wetlands of Tidewater Virginia, was grown in a greenhouse and watered with either: Distilled water (control); A weak petroleum solution (representing standard roadway runoff); Sodium chloride solution; Magnesium chloride solution; De-icing brine (50% sodium chloride and 50% magnesium chloride).Twenty grass preparations were used for each solution, and total growth (in cm) was recorded after watering every other day for 40 days.-Perform the correct statistical test to determine the p-value.-Report your answer rounded to four decimal places.-You should use formulas, functions, and the Data Analysis ToolPak in MS Excel to avoid additive rounding errors. Here are some useful functions: =t.test(array1,array2,tails,type) Produces a p-value for any…arrow_forward27. An article in Radio Engineering and Electronic Physics (1980, Vol. 25, pp. 74-79) investigated the behavior of a stochastic generator in the presence of external noise. The number of periods was measured in a sample of 100 trains for each of two different levels of noise voltage, 100 and 150 mV. For 100 mV, the mean number of periods in a train was 7.9 with s1 = 2.6. For 150 mV, the mean was 6.9 with s2 = 2.4. Use α = 0.01 and assume that each population is normally distributed and the two population variances are equal. (a) It was originally suspected that raising noise voltage would reduce mean number of periods. Do the data support this claim? (b) Calculate a confidence interval to answer the question in part (a).arrow_forwardIt has been shown that the fertilizer magnesium ammonium phosphate, Mg, NH4PO4, is an effective supplier of the nutrients necessary for plant growth. A study was conducted at George Mason University to determine a possible optimum level of fertilization, based on the enhanced vertical growth response of the chrysanthemums. Forty chrysanthemum seedlings were divided into four groups, each containing 10 plants. Each was planted in a similar pot containing a uniform growth medium. To each group of plants an increasing concentration of Mg,NH4PO4, measured in grams per bushel, was added: 50 g/bu, 100 g/bu, 200 g/bu, and 400g/bu. The sample means for each group was 15.34 cm, 17.16 cm, 18.3 cm, and 20.1 cm, respectively. Here SST = 758.035. (a) Construct the ANOVA table. (b) Use the Bonferroni correction to construct all g pairwise confidence intervals with t a df 2.792. What is a?arrow_forward
- b) What are the three models proposed as extensions of the GARCH model? Describe their advantages over the GARCH.arrow_forwardch 11. 4 Oxnard Petro, Ltd., has three interdisciplinary project development teams that function on an ongoing basis. Team members rotate from time to time. Every 4 months (three times a year) each department head rates the performance of each project team (using a 0 to 100 scale, where 100 is the best rating). Are the main effects significant? Is there an interaction?arrow_forwardResearchers interested in lead exposure due to car exhaust sampled the blood of 52 police officers subjected to constant inhalation of automobile exhaust fumes while working traffic enforcement in a primarily urban environment. The blood samples of these officers had an average lead concentration of 124.32 µg/l and a SD of 37.74 µg/l; a previous study of individuals from a nearby suburb, with no history of exposure, found an average blood level concentration of 35 µg/l. Test the hypothesis that the downtown police officers have a higher lead exposure than the group in the previous study. Interpret your results in context. Based on your preceding result, without performing a calculation, would a 99% confidence interval for the average blood concentration level of police officers contain 35 µg/l? Based on your preceding result, without performing a calculation, would a 99% confidence interval for this difference contain 0? Explain why or why not.arrow_forward
- Suppose a researcher is interested inthe effectiveness in a new childhood exercise program implemented in a SRS of schools across a particular county. In order to test the hypothesis that the new program decreases BMI (Kg/m2), the researcher takes a SRS of children from schools where the program is employed and a SRS from schools that do not employ the program and compares the results. Assume the following table represents the SRSs of students and their BMIs. Student intervention group BMI (kg/m2) Student control group BMI (kg/m2) A 18.6 A 21.6 B 18.2 B 18.9 C 19.5 C 19.4 D 18.9 D 22.6 E 24.1 F 23.6 A) Assuming that all the necessary conditions are met (normality, independence, etc.) carry out the appropriate statistical test to determine if the new exercise program is effective. Use an alpha level of 0.05. Do not assume equal variances.B) Construct a 95% confidence interval about your estimate for the average difference in BMI between the groups.arrow_forwardWhat are the difficulties in estimating the following model? Use as much detail as possible in answering this question while considering the Gauss-Markov assumptions and OLS estimator. Economic productivity = β0 + β1Unemployment + β2Innovation + θiControls + ei Where unemployment is the average unemployment rate of a country and innovation is an index of R&D performance.arrow_forwardIn a detailed study of the productivity of a laboratory, the age distribution of its workers was analyzed, and the results were as follows, the kurtosis coefficient is equal toarrow_forward
 MATLAB: An Introduction with ApplicationsStatisticsISBN:9781119256830Author:Amos GilatPublisher:John Wiley & Sons Inc
 Probability and Statistics for Engineering and th...StatisticsISBN:9781305251809Author:Jay L. DevorePublisher:Cengage Learning
 Statistics for The Behavioral Sciences (MindTap C...StatisticsISBN:9781305504912Author:Frederick J Gravetter, Larry B. WallnauPublisher:Cengage Learning
 Elementary Statistics: Picturing the World (7th E...StatisticsISBN:9780134683416Author:Ron Larson, Betsy FarberPublisher:PEARSON
 The Basic Practice of StatisticsStatisticsISBN:9781319042578Author:David S. Moore, William I. Notz, Michael A. FlignerPublisher:W. H. Freeman
 Introduction to the Practice of StatisticsStatisticsISBN:9781319013387Author:David S. Moore, George P. McCabe, Bruce A. CraigPublisher:W. H. Freeman