
Videos
In Exercises 5–20, assume that the two samples are independent simple random samples selected from
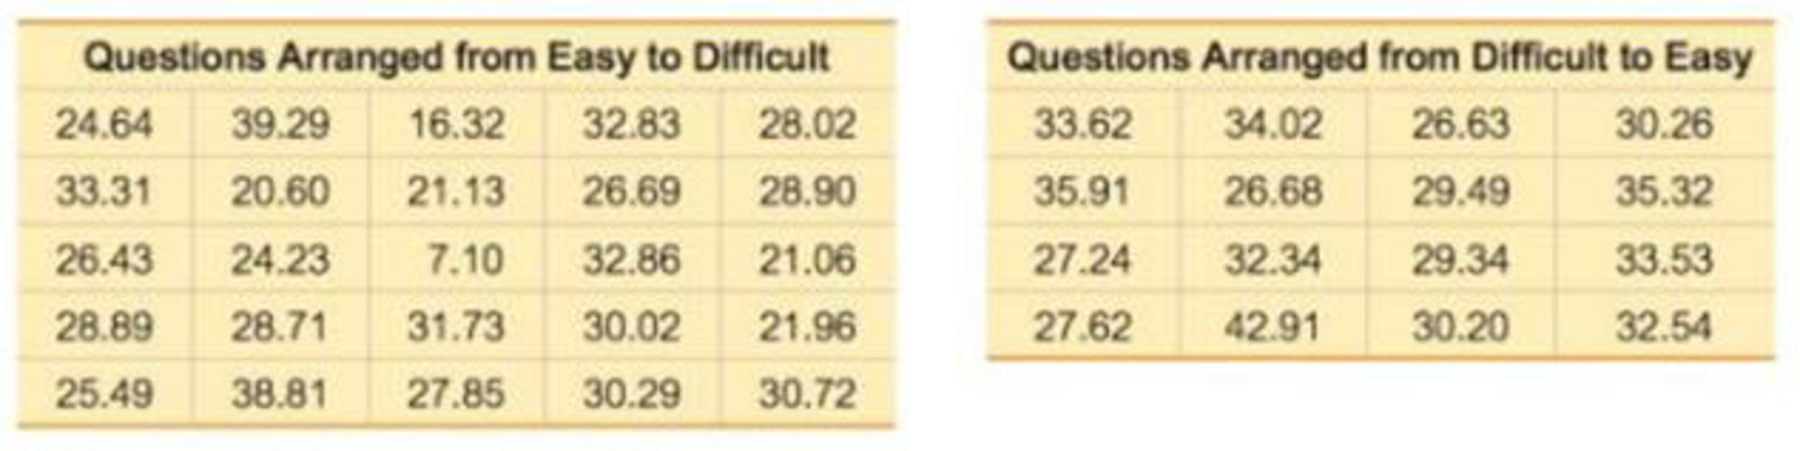
20. Blanking Out on Tests Many students have had the unpleasant experience of panicking on a test because the first question was exceptionally difficult. The arrangement of test items was studied for its effect on anxiety. The following scores are measures of “debilitating test anxiety.” which most of us call panic or blanking out (based on data from “Item Arrangement, Cognitive Entry Characteristics. Sex and Test Anxiety as Predictors of Achievement in Examination Performance,” by Klimko, Journal of Experimental Education, Vol. 52, No. 4.) Is there sufficient evidence to support the claim that the two populations of scores have different means? Is there sufficient evidence to support the claim that the arrangement of the test items has an effect on the score? Is the conclusion affected by whether the significance level is 0.05 or 0.01?
Want to see the full answer?
Check out a sample textbook solution
Chapter 9 Solutions
Essentials of Statistics (6th Edition)


- In Exercises 13–20, determine whether the data are from a discrete or continuous data set. CHIS Among the subjects surveyed as part of the California Health Interview Survey (CHIS), several subjects are randomly selected and their heights are recorded.arrow_forwardIn Exercises 5–20, assume that the two samples are independent simple random samples selected from normally distributed populations, and do not assume that the population standard deviations are equal. (Note: Answers in Appendix D include technology answers based on Formula 9-1 along with “Table” answers based on Table A-3 with df equal to the smaller of n1 − 1 and n2 − 1.) IQ and Lead Exposure Data Set 7 “IQ and Lead” in Appendix B lists full IQ scores for a random sample of subjects with low lead levels in their blood and another random sample of subjects with high lead levels in their blood. The statistics are summarized below. a. Use a 0.05 significance level to test the claim that the mean IQ score of people with low blood lead levels is higher than the mean IQ score of people with high blood lead levels. b. Construct a confidence interval appropriate for the hypothesis test in part (a). c. Does exposure to lead appear to have an effect on IQ scores?arrow_forwardRefer to the data presented in Exercise 2.86. Note that there were 50% more accidents in the 25 to less than 30 age group than in the 20 to less than 25 age group. Does this suggest that the older group of drivers in this city is more accident- prone than the younger group? What other explanation might account for the difference in accident rates?arrow_forward
- P -Values. In Exercises 17–20, do the following: a. Identify the hypothesis test as being two-tailed, left-tailed, or right-tailed. b. Find the p -value. (See Figure 8-3 on page 364.) c. Using a significance level of α = 0.05, should we reject H0 or should we fail to reject H0? The test statistic of z = −2.50 is obtained when testing the claim that p < 0.75.arrow_forwardA manufacturer knows that their items lifespans are normally distributed according to N(5.1,1.5)N(5.1,1.5).What proportion of the items' lifespans will be longer than 6 years?arrow_forwardHelp me answer the following question in the pictures with the information below: Women athletes at a certain university have a long-term graduation rate of 67%. Over the past several years, a random sample of 36 women athletes at the school showed that 21 eventually graduated. Does this indicate that the population proportion of women athletes who graduate from the university is now less than 67%? Use a 10% level of significance.arrow_forward
- Bighorn sheep are beautiful wild animals found throughout the western United States. Let x be the age of a bighorn sheep (in years), and let y be the mortality rate (percent that die) for this age group. For example, x = 1, y = 14 means that 14% of the bighorn sheep between 1 and 2 years old died. A random sample of Arizona bighorn sheep gave the following information: x 1 2 3 4 5 y 14.2 17.7 14.4 19.6 20.0 Σx = 15; Σy = 85.9; Σx2 = 55; Σy2 = 1,506.45; Σxy = 271.2 (a) Find x, y, b, and the equation of the least-squares line. (Round your answers for x and y to two decimal places. Round your least-squares estimates to three decimal places.) x = y = b = ŷ = + x (b) Draw a scatter diagram for the data. Plot the least-squares line on your scatter diagram. (c) Find the sample correlation coefficient r and the coefficient of determination r2. (Round your answers to three decimal places.) r = r2 = What percentage of variation in y is explained…arrow_forwardBighorn sheep are beautiful wild animals found throughout the western United States. Let x be the age of a bighorn sheep (in years), and let y be the mortality rate (percent that die) for this age group. For example, x = 1, y = 14 means that 14% of the bighorn sheep between 1 and 2 years old died. A random sample of Arizona bighorn sheep gave the following information: x 1 2 3 4 5 y 12.2 17.5 14.4 19.6 20.0 (c) Find the sample correlation coefficient r and the coefficient of determination r2. (Round your answers to three decimal places.) r = ? r2 = ? What percentage of variation in y is explained by the least-squares model? __________ %(Round your answer to one decimal place.) incorrect answers: I submitted this question and was told this is the answer but it is NOT CORRECT. please help !! r=0.800 r2= 0.640 64% ( above answers are incorrect)arrow_forwardBighorn sheep are beautiful wild animals found throughout the western United States. Let x be the age of a bighorn sheep (in years), and let y be the mortality rate (percent that die) for this age group. For example, x = 1, y = 14 means that 14% of the bighorn sheep between 1 and 2 years old died. A random sample of Arizona bighorn sheep gave the following information: x 1 2 3 4 5 y 13.8 19.3 14.4 19.6 20.0 Σx = 15; Σy = 87.1; Σx2 = 55; Σy2 = 1554.45; Σxy = 274b) Find the equation of the least-squares line. (Round your answers to two decimal places.) ŷ = + x (c) Find r. Find the coefficient of determination r2. (Round your answers to three decimal places.) r = r2 = d) Test the claim that the population correlation coefficient is positive at the 1% level of significance. (Round your test statistic to three decimal places.) t =arrow_forward
- Scenario: Does emotional intelligence vary based on the type of preschool a child attends? A researcher collects data on 300 four-year-olds who attend different local types of preschools. The researcher was able to collect data from four different types of preschools - Montessori, Waldorf, Parent Co-ops, and religious preschools. Emotional intelligence was quantified using the self-report Bar-On EQ-I, which ranges from 0 — 110, and is considered "scale" in nature. Assume data meets all assumptions for a parametric test. Question: What is the null hypothesis for this scenario?arrow_forwardScenario: Does emotional intelligence vary based on the type of preschool a child attends? A researcher collects data on 300 four-year-olds who attend different local types of preschools. The researcher was able to collect data from four different types of preschools - Montessori, Waldorf, Parent Co-ops, and religious preschools. Emotional intelligence was quantified using the self-report Bar-On EQ-I, which ranges from 0 — 110, and is considered "scale" in nature. Assume data meets all assumptions for a parametric test. Question: Which of the following best describes the scenario? Between-subjects Within-subjects Mixed designarrow_forwardBighorn sheep are beautiful wild animals found throughout the western United States. Let x be the age of a bighorn sheep (in years), and let y be the mortality rate (percent that die) for this age group. For example, x = 1, y = 14 means that 14% of the bighorn sheep between 1 and 2 years old died. A random sample of Arizona bighorn sheep gave the following information: x 1 2 3 4 5 y 15.8 17.3 14.4 19.6 20.0 Σx = 15; Σy = 87.1; Σx2 = 55; Σy2 = 1,540.45; Σxy = 272 (a) Find x, y, b, and the equation of the least-squares line. (Round your answers for x and y to two decimal places. Round your least-squares estimates to three decimal places.) x = y = b = ŷ = + xarrow_forward
 MATLAB: An Introduction with ApplicationsStatisticsISBN:9781119256830Author:Amos GilatPublisher:John Wiley & Sons Inc
 Probability and Statistics for Engineering and th...StatisticsISBN:9781305251809Author:Jay L. DevorePublisher:Cengage Learning
 Statistics for The Behavioral Sciences (MindTap C...StatisticsISBN:9781305504912Author:Frederick J Gravetter, Larry B. WallnauPublisher:Cengage Learning
 Elementary Statistics: Picturing the World (7th E...StatisticsISBN:9780134683416Author:Ron Larson, Betsy FarberPublisher:PEARSON
 The Basic Practice of StatisticsStatisticsISBN:9781319042578Author:David S. Moore, William I. Notz, Michael A. FlignerPublisher:W. H. Freeman
 Introduction to the Practice of StatisticsStatisticsISBN:9781319013387Author:David S. Moore, George P. McCabe, Bruce A. CraigPublisher:W. H. Freeman