
Bundle: Understandable Statistics: Concepts And Methods, 12th + Webassign, Single-term Printed Access Card
12th Edition
ISBN: 9781337605199
Author: Charles Henry Brase, Corrinne Pellillo Brase
Publisher: Brooks Cole
expand_more
expand_more
format_list_bulleted
Concept explainers
Videos
Textbook Question
Chapter 9.2, Problem 6P
Critical Thinking: Interpreting Computer Printouts Refer to the description of a computer display for regression described in Problem 5. The following Minitab display gives information regarding the relationship between the body weight of a child (in kilograms) and the metabolic rate of the child (in 100 kcal/24 hr). The data is based on information from The Merck Manual (a commonly used reference in medical schools and nursing programs).
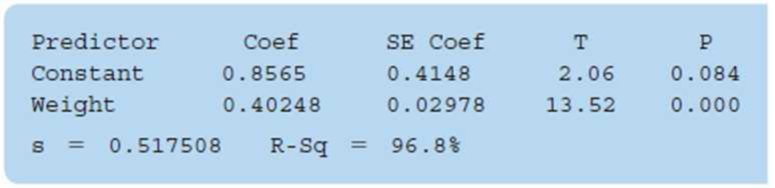
- (a) Write out the least-squares equation.
- (b) For each 1-kilogram increase in weight, how much does the metabolic rate of a child increase?
- (c) What is the value of the sample
correlation coefficient r? - (d) Interpretation What percentage of the variation in y can be explained by the corresponding variation in x and the least-squares line? What percentage is unexplained?
Expert Solution & Answer
Want to see the full answer?
Check out a sample textbook solution
Students have asked these similar questions
The St. Lucian Government is interested in predicting the number of weekly riders on the public buses using the following variables:
• • • •
Price of bus trips per weekThe population in the cityThe monthly income of ridersAverage rate to park your personal vehicle
Determine the multiple regression equation for the data.
What is the predicted value of the number of weekly riders if: price of bus trips per week = $24; population = $2,000,000; the monthly income of riders = $13,500; and average rate to park your personal vehicle = $150.
Interpret the coefficient of determination.
Bill wants to explore factors affecting work stress. He would like to examine the relationship between age, number of years at the workplace, perceived social support, and work stress. He collects data on the variables from 100 employees (males and females) working in banks.
The research question is
How accurately can work stress be predicted from linear combination of the predictors (age, social support, number of years at the workplace)?
Conduct a multiple regression analysis to answer the following questions:
What is the regression equation for all the predictors?
Write a results section based on your analysis that answers the research question.
Bill wants to explore factors affecting work stress. He would like to examine the relationship between age, number of years at the workplace, perceived social support, and work stress. He collects data on the variables from 100 employees (males and females) working in banks.
The research question is
How accurately can work stress be predicted from linear combination of the predictors (age, social support, number of years at the workplace)?
Conduct a multiple regression analysis to answer the following questions:
State the hypothesis for this study.
Chapter 9 Solutions
Bundle: Understandable Statistics: Concepts And Methods, 12th + Webassign, Single-term Printed Access Card
Ch. 9.1 - Statistical Literacy When drawing a scatter...Ch. 9.1 - Prob. 2PCh. 9.1 - Prob. 3PCh. 9.1 - Prob. 4PCh. 9.1 - Prob. 5PCh. 9.1 - Prob. 6PCh. 9.1 - Prob. 7PCh. 9.1 - Prob. 8PCh. 9.1 - Prob. 9PCh. 9.1 - Critical Thinking: Lurking Variables Over the past...
Ch. 9.1 - Prob. 11PCh. 9.1 - Prob. 12PCh. 9.1 - Prob. 13PCh. 9.1 - Health Insurance: Administrative Cost The...Ch. 9.1 - Prob. 15PCh. 9.1 - Geology: Earthquakes Is the magnitude of an...Ch. 9.1 - Prob. 17PCh. 9.1 - Prob. 18PCh. 9.1 - Prob. 19PCh. 9.1 - Prob. 20PCh. 9.1 - Prob. 21PCh. 9.1 - Prob. 22PCh. 9.1 - Prob. 23PCh. 9.1 - Prob. 24PCh. 9.2 - Statistical Literacy In the least-squares line...Ch. 9.2 - Prob. 2PCh. 9.2 - Critical Thinking When we use a least-squares line...Ch. 9.2 - Prob. 4PCh. 9.2 - Prob. 5PCh. 9.2 - Critical Thinking: Interpreting Computer Printouts...Ch. 9.2 - Prob. 7PCh. 9.2 - For Problems 718, please do the following. (a)...Ch. 9.2 - Prob. 9PCh. 9.2 - For Problems 718, please do the following. (a)...Ch. 9.2 - Prob. 11PCh. 9.2 - Prob. 12PCh. 9.2 - For Problems 718, please do the following. (a)...Ch. 9.2 - Prob. 14PCh. 9.2 - Prob. 15PCh. 9.2 - For Problems 718, please do the following. (a)...Ch. 9.2 - Prob. 17PCh. 9.2 - Prob. 18PCh. 9.2 - Prob. 19PCh. 9.2 - Residual Plot: Miles per Gallon Consider the data...Ch. 9.2 - Prob. 21PCh. 9.2 - Prob. 22PCh. 9.2 - Prob. 23PCh. 9.2 - Prob. 24PCh. 9.2 - Prob. 25PCh. 9.3 - Prob. 1PCh. 9.3 - Prob. 2PCh. 9.3 - Prob. 3PCh. 9.3 - Prob. 4PCh. 9.3 - Prob. 5PCh. 9.3 - Prob. 6PCh. 9.3 - Prob. 7PCh. 9.3 - In Problems 712, parts (a) and (b) relate to...Ch. 9.3 - Prob. 9PCh. 9.3 - Prob. 10PCh. 9.3 - In Problems 712, parts (a) and (b) relate to...Ch. 9.3 - Prob. 12PCh. 9.3 - Prob. 13PCh. 9.3 - Prob. 14PCh. 9.3 - Prob. 15PCh. 9.3 - Expand Your Knowledge: Time Series and Serial...Ch. 9.3 - Prob. 17PCh. 9.4 - Statistical Literacy Given the linear regression...Ch. 9.4 - Prob. 2PCh. 9.4 - For Problems 3-6, use appropriate multiple...Ch. 9.4 - For Problems 3-6, use appropriate multiple...Ch. 9.4 - Prob. 5PCh. 9.4 - Prob. 6PCh. 9 - Prob. 1CRPCh. 9 - Prob. 2CRPCh. 9 - Prob. 3CRPCh. 9 - Prob. 4CRPCh. 9 - Prob. 5CRPCh. 9 - Prob. 6CRPCh. 9 - Prob. 7CRPCh. 9 - Prob. 8CRPCh. 9 - Prob. 9CRPCh. 9 - Prob. 10CRPCh. 9 - Prob. 1DHCh. 9 - Prob. 1LCCh. 9 - Prob. 1UTCh. 9 - Prob. 2UTCh. 9 - Prob. 3UTCh. 9 - Prob. 4UTCh. 9 - Prob. 5UTCh. 9 - Prob. 6UTCh. 9 - Prob. 7UTCh. 9 - In Problems 16, please use the following steps (i)...Ch. 9 - Prob. 2CURPCh. 9 - Prob. 3CURPCh. 9 - Prob. 4CURPCh. 9 - Prob. 5CURPCh. 9 - Prob. 6CURPCh. 9 - Prob. 8CURPCh. 9 - Linear Regression: Blood Glucose Let x be a random...
Knowledge Booster


Learn more about
Need a deep-dive on the concept behind this application? Look no further. Learn more about this topic, statistics and related others by exploring similar questions and additional content below.Similar questions
- Mark Price, the new productions manager for Speakers and Company, needs to find out which variable most affects the demand for their line of stereo speakers. He is uncertain whether the unit price of the product or the effects of increased marketing are the main drivers in sales and wants to use regression analysis to figure out which factor drives more demand for its particular market. Pertinent information was collected by an extensive marketing project that lasted over the past 12 years and was reduced to the data that follow: YEAR 123456789 10 11 12 UNIT SALES (THOUSANDS) 396 696 896 1,285 1,155 1,186 896 1,118 985 1,334 926 820 PRICE $/UNIT 282 219 206 210 219 209 218 206 220 206 226 236 ADVERTISING ($000) 600 829 1,118 1,413 1,214 1,285 907 1,118 708 907 708 682 a. Perform a regression analysis based on these data using Excel. (Negative values should be indicated by a minus sign. Round your answers to 4 decimal places.)arrow_forwardPROBLEM :The amount spent on medical expenses per day is correlated with other health factors for 5 adult males. A study came up with the following table: Medical Amount spentcost for alcohol Weight Age2100 200 185 502378 250 200 421657 100 175 372584 200 225 542658 250 220 32 Which of the following factors has a significant effect on medical expenses? Create the regression equation for the problem.arrow_forwardThe hiring managers want to compare three different employment sources: Newspaper/Magazine, CareerBuilder, and Monster.com. Perform simple regressions as you did above predicting allocations for month 13 for those three employment sources. Which of the following statements would be the best conclusion from your analysis? The model R-square for Monster.com is the highest R-square value of the three platforms. Therefore, management will likely provide the most funding for that platform, and we should focus on that above the other two. The models for Monster.com and Newspaper/Magazine are both significant, which means we should focus on these two platforms over CareerBuilder because management will likely provide us the most funding for those two platforms. The predicted monthly amount for CareerBuilder is lower than the predicted amount for Newspaper/Magazine. Therefore, they should expect the lowest amount of funding for CareerBuilder out of all of the three, and should concentrate on…arrow_forward
- According to human capital theory, a person’s earning is linked to her level of education – there is a relationship between workers income and years of education. Using data from the Labour Force Survey, a researcher found the following regression results for earnings on intercept, years of education, experience, and experience squared: Earnings = 5.24 + 0.035 educ + 0.165 exper – 0.003 exper2 (2.45) (0.012) (0.031) (0.001) Construct a 95% confidence interval for the effect of years of education on earnings ? 2. Consider an individual with 8 years of experience. What would you expect to be the return to two (2) additional years of experience (the effect on earnings)? 3. According to economic theory,…arrow_forwardThe following three problems refer to the data sets displayed below: ++++ a b 8. Which data set has the greatest slope of the least squares regression line?arrow_forwardBiologist Theodore Garland, Jr. studied the relationship between running speeds and morphology of 49 species of cursorial mammals (mammals adapted to or specialized for running). One of the relationships he investigated was maximal sprint speed in kilometers per hour and the ratio of metatarsal-to-femur length. A least-squares regression on the data he collected produces the equation ŷ = 37.67 + 33.18x %3D where x is metatarsal-to-femur ratio and ŷ is predicted maximal sprint speed in kilometers per hour. The standard error of the intercept is 5.69 and the standard error of the slope is 7.94. Construct an 80% confidence interval for the slope of the population regression line. Give your answers precise to at least two decimal places. Lower limit: Upper limit:arrow_forward
- David's Landscaping has collected data on home values (in thousands of $) and expenditures (in thousands of $) on landscaping with the hope of developing a predictive model to help marketing to potential new clients. Data for 14 households may be found in the file Landscape. Click on the datafile logo to reference the data. (NEED ANSWERS FOR C, D, and E) c. Use the least squares method to develop the estimated regression equation (to 5 decimals). d. For every additional $1000 in home value, estimate how much additional will be spent on landscaping (to 2 decimals). e. Use the equation estimated in part (c) to predict the landscaping expenditures for a home valued at $575,000 (to the nearest whole number).arrow_forwardMark Price, the new productions manager for Speakers and Company, needs to find out which variable most affects the demand for their line of company speakers. He is uncertain whether the unit price of the product or the effects of increased marketing are the main drivers in sales and wants to use regression analysis to figure out which factor drives more demand for its particular market. Pertinent information was collected by an extensive marketing project that lasted over the past 12 years and was reduced to the data that follow: YEAR 1 2 3 4 5 6 7 B 9 10 11 12 UNIT SALES (THOUSANDS) 398 698 898 y bar 1,304 1,163 1,195 898 1,200 982 1,235 875 811 PRICE $ PER UNIT 283 209 213 220 209 200 220 209 230 213 216 243 ADVERTISING ($000) 621 821 1,200 1,405 1,210 1,304 875 1,200 691 875 691 691 a. Perform a regression analysis based on these data using Excel. Note: Negative values should be indicated by a minus sign. Round your answers to 4 decimal places. Price advertisingarrow_forward
arrow_back_ios
arrow_forward_ios
Recommended textbooks for you
 Calculus For The Life SciencesCalculusISBN:9780321964038Author:GREENWELL, Raymond N., RITCHEY, Nathan P., Lial, Margaret L.Publisher:Pearson Addison Wesley,
 Algebra and Trigonometry (MindTap Course List)AlgebraISBN:9781305071742Author:James Stewart, Lothar Redlin, Saleem WatsonPublisher:Cengage Learning
 Glencoe Algebra 1, Student Edition, 9780079039897...AlgebraISBN:9780079039897Author:CarterPublisher:McGraw Hill
 Functions and Change: A Modeling Approach to Coll...AlgebraISBN:9781337111348Author:Bruce Crauder, Benny Evans, Alan NoellPublisher:Cengage Learning
Calculus For The Life Sciences
Calculus
ISBN:9780321964038
Author:GREENWELL, Raymond N., RITCHEY, Nathan P., Lial, Margaret L.
Publisher:Pearson Addison Wesley,
Algebra and Trigonometry (MindTap Course List)
Algebra
ISBN:9781305071742
Author:James Stewart, Lothar Redlin, Saleem Watson
Publisher:Cengage Learning
Glencoe Algebra 1, Student Edition, 9780079039897...
Algebra
ISBN:9780079039897
Author:Carter
Publisher:McGraw Hill
Functions and Change: A Modeling Approach to Coll...
Algebra
ISBN:9781337111348
Author:Bruce Crauder, Benny Evans, Alan Noell
Publisher:Cengage Learning
Correlation Vs Regression: Difference Between them with definition & Comparison Chart; Author: Key Differences;https://www.youtube.com/watch?v=Ou2QGSJVd0U;License: Standard YouTube License, CC-BY
Correlation and Regression: Concepts with Illustrative examples; Author: LEARN & APPLY : Lean and Six Sigma;https://www.youtube.com/watch?v=xTpHD5WLuoA;License: Standard YouTube License, CC-BY