
ELEMENTARY STATISTICS W/CONNECT >IP<
4th Edition
ISBN: 9781259746826
Author: Bluman
Publisher: MCG
expand_more
expand_more
format_list_bulleted
Concept explainers
Videos
Textbook Question
Chapter 9.3, Problem 12E
For Exercises 2 through 12, perform each of these steps. Assume that all variables are normally or approximately
a. State the hypotheses and identify the claim.
b. Find the critical value(s).
c. Compute the test value.
d. Make the decision.
e. Summarize the results.
Use the traditional method of hypothesis testing unless otherwise specified.
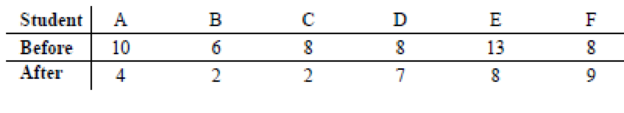
12. Mistakes in a Song A random sample of six music students played a short song, and the number of mistakes in music each student made was recorded. After they practiced the song 5 times, the number of mistakes each student made was recorded. The data are shown. At α = 0.05, can it be concluded that there was a decrease in the mean number of mistakes?
Expert Solution & Answer
Want to see the full answer?
Check out a sample textbook solution
Students have asked these similar questions
Given the situation below, create a problem and determine (a) the null and alternative hypotheses, (b) test statistic, (c) rejection region, and (d) applicability of the CLT.
The proportion of mango trees on an island that produce only dwarf fruit is p1. The proportion of mango trees on a different island that produce only dwarf fruit is p2. What is the null hypothesis for a test to determine if the proportions are different between the two islands?
Select the correct answer below:
H0: p1−p2≠0
H0: p1−p2=0
H0: p1−p2>0
H0: p1−p2<0
Determine which of the following statements are true about the critical region.
The critical region is a term used when the null hypothesis is rejected.
The critical region is comprised of extreme sample values that are very unlikely to be obtained if the alternative hypothesis is true.
The critical regions is determined by the alpha level.
The critical region is comprised of extreme samples values that are very unlikely to be obtained if the null hypothesis is true
Chapter 9 Solutions
ELEMENTARY STATISTICS W/CONNECT >IP<
Ch. 9.1 - Home Runs For a sports radio talk show, you are...Ch. 9.1 - Explain the difference between testing a single...Ch. 9.1 - When a researcher selects all possible pairs of...Ch. 9.1 - What three assumptions must be met when you are...Ch. 9.1 - Show two different ways to state that the means of...Ch. 9.1 - Prob. 5ECh. 9.1 - Prob. 6ECh. 9.1 - For Exercises 5 through 16, perform each of the...Ch. 9.1 - For Exercises 5 through 16, perform each of the...Ch. 9.1 - For Exercises 5 through 16, perform each of the...
Ch. 9.1 - For Exercises 5 through 16, perform each of the...Ch. 9.1 - Prob. 11ECh. 9.1 - For Exercises 5 through 16, perform each of the...Ch. 9.1 - Prob. 13ECh. 9.1 - For Exercises 5 through 16, perform each of the...Ch. 9.1 - Self-Esteem Scores In a study of a group of women...Ch. 9.1 - Ages of College Students The dean of students...Ch. 9.1 - Prob. 17ECh. 9.1 - Prob. 18ECh. 9.1 - Prob. 19ECh. 9.1 - Prob. 20ECh. 9.1 - Television Watching The average number of hours of...Ch. 9.1 - For Exercises 5 through 16, perform each of the...Ch. 9.1 - Prob. 23ECh. 9.1 - Home Prices According to the almanac, the average...Ch. 9.1 - Exam Scores at Private and Public Schools A...Ch. 9.1 - Sale Prices for Houses The average sales price of...Ch. 9.1 - Average Earnings for College Graduates The average...Ch. 9.2 - Too Long on the Telephone A company collects data...Ch. 9.2 - Prob. 1ECh. 9.2 - For these exercises, perform each of these steps....Ch. 9.2 - Prob. 3ECh. 9.2 - Prob. 4ECh. 9.2 - For these exercises, perform each of these steps....Ch. 9.2 - For these exercises, perform each of these steps....Ch. 9.2 - For these exercises, perform each of these steps....Ch. 9.2 - For these exercises, perform each of these steps....Ch. 9.2 - Prob. 9ECh. 9.2 - Find the 95% confidence interval for the...Ch. 9.2 - Prob. 11ECh. 9.2 - Prob. 12ECh. 9.2 - Prob. 13ECh. 9.2 - Prob. 14ECh. 9.2 - Prob. 15ECh. 9.2 - Ages of Homes Whiting, Indiana, leads the Top 100...Ch. 9.2 - Prob. 17ECh. 9.2 - Out-of-State Tuitions The out-of-state tuitions...Ch. 9.2 - Prob. 19ECh. 9.2 - For these exercises, perform each of these steps....Ch. 9.2 - Prob. 21ECh. 9.2 - Prob. 22ECh. 9.3 - Air Quality As a researcher for the EPA, you have...Ch. 9.3 - Classify each as independent or dependent samples....Ch. 9.3 - For Exercises 2 through 12, perform each of these...Ch. 9.3 - For Exercises 2 through 12, perform each of these...Ch. 9.3 - For Exercises 2 through 12, perform each of these...Ch. 9.3 - Prob. 5ECh. 9.3 - For Exercises 2 through 12, perform each of these...Ch. 9.3 - For Exercises 2 through 12, perform each of these...Ch. 9.3 - For Exercises 2 through 12, perform each of these...Ch. 9.3 - For Exercises 2 through 12, perform each of these...Ch. 9.3 - Toy Assembly Test An educational researcher...Ch. 9.3 - Prob. 11ECh. 9.3 - For Exercises 2 through 12, perform each of these...Ch. 9.3 - Prob. 13ECCh. 9.4 - Smoking and Education You are researching the...Ch. 9.4 - Prob. 1ECh. 9.4 - Find p and q for each. a. n = 36, X = 20 b. n =...Ch. 9.4 - Prob. 3ECh. 9.4 - Find each X, given p. a. p = 0.24, n = 300 b. p =...Ch. 9.4 - Prob. 5ECh. 9.4 - Find p and q. a. X1 = 6, n1 = 15, X2 = 9, n2 = 15...Ch. 9.4 - For Exercises 7 through 27, perform these steps....Ch. 9.4 - Prob. 8ECh. 9.4 - Prob. 9ECh. 9.4 - For Exercises 7 through 27, perform each of these...Ch. 9.4 - Prob. 11ECh. 9.4 - For Exercises 7 through 27, perform each of these...Ch. 9.4 - Prob. 13ECh. 9.4 - For Exercises 7 through 27, perform each of these...Ch. 9.4 - Prob. 15ECh. 9.4 - Smoking Survey National statistics show that 23%...Ch. 9.4 - For Exercises 7 through 27, perform each of these...Ch. 9.4 - For Exercises 7 through 27, perform each of these...Ch. 9.4 - Prob. 19ECh. 9.4 - For Exercises 7 through 27, perform these steps....Ch. 9.4 - For Exercises 7 through 27, perform these steps....Ch. 9.4 - For Exercises 7 through 27, perform these steps....Ch. 9.4 - For Exercises 7 through 27, perform these steps....Ch. 9.4 - For Exercises 7 through 27, perform these steps....Ch. 9.4 - For Exercises 7 through 27, perform these steps....Ch. 9.4 - For Exercises 7 through 27, perform these steps....Ch. 9.4 - For Exercises 7 through 27, perform these steps....Ch. 9.4 - Prob. 28ECCh. 9.5 - Prob. 1ACCh. 9.5 - When one is computing the F test value, what...Ch. 9.5 - Why is the critical region always on the right...Ch. 9.5 - What are the two different degrees of freedom...Ch. 9.5 - What are the characteristics of the F...Ch. 9.5 - Prob. 5ECh. 9.5 - Using Table H, find the critical value for each....Ch. 9.5 - Prob. 7ECh. 9.5 - Using Table H, find the P-value interval for each...Ch. 9.5 - Prob. 9ECh. 9.5 - For Exercises 9 through 24, perform the following...Ch. 9.5 - For Exercises 9 through 24, perform the following...Ch. 9.5 - For Exercises 9 through 24, perform the following...Ch. 9.5 - Prob. 13ECh. 9.5 - For Exercises 9 through 24, perform the following...Ch. 9.5 - For Exercises 9 through 24, perform the following...Ch. 9.5 - For Exercises 9 through 24, perform the following...Ch. 9.5 - Prob. 17ECh. 9.5 - For Exercises 9 through 24, perform the following...Ch. 9.5 - For Exercises 9 through 24, perform the following...Ch. 9.5 - For Exercises 9 through 24, perform the following...Ch. 9.5 - Prob. 21ECh. 9.5 - For Exercises 9 through 24, perform the following...Ch. 9.5 - Prob. 23ECh. 9.5 - For Exercises 9 through 24, perform the following...Ch. 9 - For each exercise, perform these steps. Assume...Ch. 9 - Prob. 9.1.2RECh. 9 - Prob. 9.2.3RECh. 9 - Prob. 9.2.4RECh. 9 - For each exercise, perform these steps. Assume...Ch. 9 - Prob. 9.2.6RECh. 9 - High and Low Temperatures March is a month of...Ch. 9 - Testing After Review A statistics class was given...Ch. 9 - Lay Teachers in Religious Schools A study found a...Ch. 9 - Prob. 9.4.10RECh. 9 - Prob. 9.5.11RECh. 9 - Heights of World Famous Cathedrals The heights (in...Ch. 9 - Prob. 9.5.13RECh. 9 - Prob. 1DACh. 9 - Prob. 2DACh. 9 - Prob. 3DACh. 9 - Prob. 4DACh. 9 - Prob. 5DACh. 9 - Prob. 1CQCh. 9 - Prob. 2CQCh. 9 - Prob. 3CQCh. 9 - Prob. 4CQCh. 9 - Prob. 5CQCh. 9 - To test the equality of two proportions, you would...Ch. 9 - Prob. 7CQCh. 9 - Prob. 8CQCh. 9 - Complete these statements with the best answer. 9....Ch. 9 - Prob. 10CQCh. 9 - Prob. 11CQCh. 9 - Prob. 12CQCh. 9 - Prob. 13CQCh. 9 - Prob. 14CQCh. 9 - Prob. 15CQCh. 9 - Prob. 16CQCh. 9 - For these exercises, perform each of these steps....Ch. 9 - Prob. 18CQCh. 9 - Prob. 19CQCh. 9 - Mathematical Skills In an effort to improve the...Ch. 9 - Prob. 21CQCh. 9 - Prob. 22CQCh. 9 - Prob. 23CQCh. 9 - Prob. 24CQCh. 9 - Prob. 25CQ
Knowledge Booster


Learn more about
Need a deep-dive on the concept behind this application? Look no further. Learn more about this topic, statistics and related others by exploring similar questions and additional content below.Similar questions
- Molly works for a meat producer, and she needs to determine whether containers of ground beef have the correct fat content. She obtains a random sample of 120 containers of ground beef and finds that 84 percent have the correct fat content. Molly then conducts a hypothesis test of H0:p=0.80H0:p=0.80 versus Ha:p≠0.80Ha:p≠0.80 and calculates a test statistic of 1.10 with a pp-value of 0.273. Which of the following best represents the meaning of the pp-value? If the population proportion is 0.84, the probability of observing a sample proportion of 0.80 is 0.273. A If the population proportion is 0.84, the probability of observing a sample proportion of at least 0.04 less than 0.84 is 0.273. B If the population proportion is 0.80, the probability of observing a sample proportion within 0.04 of 0.80 is 0.273. C If the population proportion is 0.80, the probability of observing a sample proportion at least 0.04 greater than 0.80 is 0.273. D If the…arrow_forwardMolly works for a meat producer, and she needs to determine whether containers of ground beef have the correct fat content. She obtains a random sample of 120 containers of ground beef and finds that 84 percent have the correct fat content. Molly then conducts a hypothesis test of H0:p=0.80H0:p=0.80 versus Ha:p≠0.80Ha:p≠0.80 and calculates a test statistic of 1.10 with a pp-value of 0.273. Which of the following best represents the meaning of the pp-value? If the population proportion is 0.84, the probability of observing a sample proportion of 0.80 is 0.273. A If the population proportion is 0.84, the probability of observing a sample proportion of at least 0.04 less than 0.84 is 0.273. B If the population proportion is 0.80, the probability of observing a sample proportion within 0.04 of 0.80 is 0.273. C If the population proportion is 0.80, the probability of observing a sample proportion at least 0.04 greater than 0.80 is 0.273. D If the…arrow_forwardUse the traditional method in testing the hypothesis in the problems below. In each problem, state the following:a. State the hypotheses and identify the claim.b. Find the critical value(s)c. Find the test value The manager of the cosmetics section of a large department store wants to determine whether newspaper advertising really does affect sales. For her experiment, she randomly selects 15 items currently in stock and proceeds to establish a baseline. The 15 items are priced at their usual competitive values, and the quantity of each item sold for a 1-week period is recorded. Then, without changing their price, she places a large ad in the newspaper, advertising the 15 items. Again, she records the quantity sold for a 1-week period. The results follow. Item 1 2 3 4 5 6 7 8 9 10 11 12 13 14 15No. of Items Sold Before Ad 25 18 3 42 16 20 23 32 60 40 27 7 13 23 16No. of Items Sold After Ad 32 24 7 40 19 25 23 35 60 43 28 11 12 32 28arrow_forward
- Which of the following is the correct way to report the results of a hypothesis test and a measure of effect size using a tstatistic? a. r2 = 0.42, t(19) = 2.30 , p < .05 b. t(19) = 2.30, p < .05, r2 = 0.42 c. t = 2.30, df = 19, p < .05, r2 = 0.42 d. t(19) = 2.30, r2 = 0.42, p < .05arrow_forwardIf the proportion of the population in City A that is over 65 years old is p1 and the proportion of the population in City B that is over 65 years old is p2, what is the null hypothesis for a test to determine if the proportion of the population that is over 65 years old is greater in City A? Select the correct answer below: H0: p1−p2=0 H0: p1−p2>0 H0: p1−p2<0 H0: p1−p2≠0arrow_forwardA fast-food restaurant claims that a small order of french fries contains 120 calories. A nutritionist is concerned that the true average calorie count is higher than that. The nutritionist randomly selects 35 small orders of french fries and determines their calories. The resulting sample mean is 155.6 calories, and the pp-value for the hypothesis test is 0.00093. Which of the following is a correct interpretation of the p-value? A)If the population mean is 120 calories, the p -value of 0.00093 is the probability of observing a sample mean of 155.6 calories or more. B) If the population mean is 120 calories, the p -value of 0.00093 is the probability of observing a sample mean of 155.6 calories or less. C)If the population mean is 120 calories, the p -value of 0.00093 is the probability of observing a sample mean of 155.6 calories or more, or a sample mean of 84.4 calories or less. .D)If the population mean is 155.6 calories, the p -value of 0.00093…arrow_forward
- Suppose that you are to conduct the following hypothesis test: ?0:?1:??=≠450450H0:μ=450H1:μ≠450 Assume that you know that ?=105σ=105, ?=50n=50, ?¯=430.05x¯=430.05, and take ?=0.005α=0.005. Draw the sampling distribution, and use it to determine each of the following: A. The value of the standardized test statistic: Note: For the next part, your answer should use interval notation. An answer of the form (−∞,?)(−∞,a) is expressed (-infty, a), an answer of the form (?,∞)(b,∞) is expressed (b, infty), and an answer of the form (−∞,?)∪(?,∞)(−∞,a)∪(b,∞) is expressed (-infty, a)U(b, infty). B. The rejection region for the standardized test statistic:arrow_forwardSuppose that you are to conduct the following hypothesis test: ?0:?1:??=≠450450H0:μ=450H1:μ≠450 Assume that you know that ?=105σ=105, ?=50n=50, ?¯=430.05x¯=430.05, and take ?=0.005α=0.005. Draw the sampling distribution, and use it to determine each of the following: A. The value of the standardized test statistic: Note: For the next part, your answer should use interval notation. An answer of the form (−∞,?)(−∞,a) is expressed (-infty, a), an answer of the form (?,∞)(b,∞) is expressed (b, infty), and an answer of the form (−∞,?)∪(?,∞)(−∞,a)∪(b,∞) is expressed (-infty, a)U(b, infty). B. The rejection region for the standardized test statistic: C. The p-value isarrow_forwardIf all other values are held constant, what happens to the value of t when sample size increases ?arrow_forward
- In quality–control applications of hypothesis testing, the null and alternative hypotheses are frequently specified as H0: The production process is performing satisfactorily and Ha: The process is performing in an unsatisfactory manner. Accordingly, α is sometimes referred to as the producer's risk, while β is called the consumer's risk. An injection molder produces plastic golf tees with a mean weight of 0.252 ounce. To investigate whether the injection molder is operating satisfactorily, 40 tees were randomly sampled from the last hour's production. Their weights (in ounces) are listed in the accompanying table. Complete parts a through g. 0.248 0.251 0.249 0.250 0.255 0.251 0.251 0.248 0.248 0.251 0.254 0.252 0.256 0.251 0.252 0.253 0.250 0.254 0.254 0.254 0.251 0.251 0.252 0.249 0.249 0.251 0.252 0.253 0.248 0.252 0.252 0.252 0.249 0.252 0.249 0.253 0.252 0.249 0.249 0.251 b.…arrow_forwardIn quality–control applications of hypothesis testing, the null and alternative hypotheses are frequently specified as H0: The production process is performing satisfactorily and Ha: The process is performing in an unsatisfactory manner. Accordingly, α is sometimes referred to as the producer's risk, while β is called the consumer's risk. An injection molder produces plastic golf tees with a mean weight of 0.252 ounce. To investigate whether the injection molder is operating satisfactorily, 40 tees were randomly sampled from the last hour's production. Their weights (in ounces) are listed in the accompanying table a. Write H0 and Ha in terms of the true mean weight of the golf tees, μ. A. H0: μ=0.252 Ha: μ<0.252 B. H0: μ=0.252 Ha: μ≠0.252 C. H0: μ=0.252 Ha: μ>0.252 D. H0: μ≠0.252 Ha: μ=arrow_forwardThe level of significance for a hypothesis is 0.01. If you compute a p-value of 0.0157 what decision should you make?arrow_forward
arrow_back_ios
arrow_forward_ios
Recommended textbooks for you
 MATLAB: An Introduction with ApplicationsStatisticsISBN:9781119256830Author:Amos GilatPublisher:John Wiley & Sons Inc
 Probability and Statistics for Engineering and th...StatisticsISBN:9781305251809Author:Jay L. DevorePublisher:Cengage Learning
 Statistics for The Behavioral Sciences (MindTap C...StatisticsISBN:9781305504912Author:Frederick J Gravetter, Larry B. WallnauPublisher:Cengage Learning
 Elementary Statistics: Picturing the World (7th E...StatisticsISBN:9780134683416Author:Ron Larson, Betsy FarberPublisher:PEARSON
 The Basic Practice of StatisticsStatisticsISBN:9781319042578Author:David S. Moore, William I. Notz, Michael A. FlignerPublisher:W. H. Freeman
 Introduction to the Practice of StatisticsStatisticsISBN:9781319013387Author:David S. Moore, George P. McCabe, Bruce A. CraigPublisher:W. H. Freeman
MATLAB: An Introduction with Applications
Statistics
ISBN:9781119256830
Author:Amos Gilat
Publisher:John Wiley & Sons Inc
Probability and Statistics for Engineering and th...
Statistics
ISBN:9781305251809
Author:Jay L. Devore
Publisher:Cengage Learning
Statistics for The Behavioral Sciences (MindTap C...
Statistics
ISBN:9781305504912
Author:Frederick J Gravetter, Larry B. Wallnau
Publisher:Cengage Learning
Elementary Statistics: Picturing the World (7th E...
Statistics
ISBN:9780134683416
Author:Ron Larson, Betsy Farber
Publisher:PEARSON
The Basic Practice of Statistics
Statistics
ISBN:9781319042578
Author:David S. Moore, William I. Notz, Michael A. Fligner
Publisher:W. H. Freeman
Introduction to the Practice of Statistics
Statistics
ISBN:9781319013387
Author:David S. Moore, George P. McCabe, Bruce A. Craig
Publisher:W. H. Freeman
Hypothesis Testing - Solving Problems With Proportions; Author: The Organic Chemistry Tutor;https://www.youtube.com/watch?v=76VruarGn2Q;License: Standard YouTube License, CC-BY
Hypothesis Testing and Confidence Intervals (FRM Part 1 – Book 2 – Chapter 5); Author: Analystprep;https://www.youtube.com/watch?v=vth3yZIUlGQ;License: Standard YouTube License, CC-BY