
Videos
For Exercises 2 through 12, perform each of these steps. Assume that all variables are normally or approximately
a. State the hypotheses and identify the claim.
b. Find the critical value(s).
c. Compute the test value.
d. Make the decision.
e. Summarize the results.
Use the traditional method of hypothesis testing unless otherwise specified.
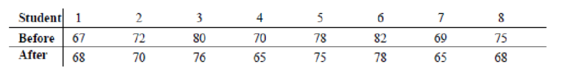
4. Obstacle Course Times An obstacle course was set up on a campus, and 8 randomly selected volunteers were given a chance to complete it while they were being timed. They then sampled a new energy drink and were given the opportunity to run the course again. The “before” and “after” times in seconds are shown. Is there sufficient evidence at α = 0.05 to conclude that the students did better the second time? Discuss possible reasons for your results.

Trending nowThis is a popular solution!

Chapter 9 Solutions
ELEMENTARY STATISTICS W/CONNECT >IP<


- In each of Exercises, we have given the P-value for a hypothesis test. For each exercise, refer to Table to determine the strength of the evidence against the null hypothesis. P-value Evidence against H0 P > 0.10 Weak or none 0.05 < P ≤ 0.10 Moderate 0.01 < P ≤ 0.05 Strong P ≤ 0.01 Very strong P = 0.086arrow_forwardThe effectiveness of a new bug repellent is tested on 1616 subjects for a 10 hour period. (Assume normally distributed population.) Based on the number and location of the bug bites, the percentage of surface area exposed protected from bites was calculated for each of the subjects. The results were as follows: ?⎯⎯⎯=92x¯=92, ?=13 s=13 The new repellent is considered effective if it provides a percent repellency of at least 9090. Using ?=0.05α=0.05, construct a hypothesis test with null hypothesis ?≤90μ≤90 and alternative hypothesis ?>90μ>90 to determine whether the mean repellency of the new bug repellent is greater than 9090 by computing the following: (a) the degree of freedom (b) the test statistic The final conclusion is A. There is not sufficient evidence to reject the null hypothesis that ?≤90μ≤90. Our results do not provide enough evidence that the new bug repellent is effective. B. We can reject the null hypothesis that ?≤90μ≤90. Our results indicate that…arrow_forwardgiven normally distributed sample x=12 and s=3, use the Empirical Rule determine the upper and lower bounds to contain approximately 95% of your dataarrow_forward
- A dental assistant is interested in the proportion of patients that need a root canal. Let the proportion of patients that need a root canal be p. If the dental assistant wanted to know if the proportion of patients that need a root canal is more than 20%, what are the null and alternative hypotheses? Select the correct answer below: H0: p=0.20; Ha: p<0.20 H0: p>0.20; Ha: p=0.20 H0: p=0.20; Ha: p>0.20 H0: μ=0.20; Ha: μ>0.20arrow_forwardUse the traditional method in testing the hypothesis in the problems below. In each problem, state the following:a. State the hypotheses and identify the claim.b. Find the critical value(s)c. Find the test value The manager of the cosmetics section of a large department store wants to determine whether newspaper advertising really does affect sales. For her experiment, she randomly selects 15 items currently in stock and proceeds to establish a baseline. The 15 items are priced at their usual competitive values, and the quantity of each item sold for a 1-week period is recorded. Then, without changing their price, she places a large ad in the newspaper, advertising the 15 items. Again, she records the quantity sold for a 1-week period. The results follow. Item 1 2 3 4 5 6 7 8 9 10 11 12 13 14 15No. of Items Sold Before Ad 25 18 3 42 16 20 23 32 60 40 27 7 13 23 16No. of Items Sold After Ad 32 24 7 40 19 25 23 35 60 43 28 11 12 32 28arrow_forwardIf the proportion of the population in City A that is over 65 years old is p1 and the proportion of the population in City B that is over 65 years old is p2, what is the null hypothesis for a test to determine if the proportion of the population that is over 65 years old is greater in City A? Select the correct answer below: H0: p1−p2=0 H0: p1−p2>0 H0: p1−p2<0 H0: p1−p2≠0arrow_forward
- State the null and alternative hypotheses to be used in testing the following claims also explain type of test.(a) At most, 20% of next year’s wheat crop will be exported to the Soviet Union.(b) On the average, American homemakers drink 3 cups of coffee per day.(c) The proportion of college graduates in Virginia this year who majored in the social sciences is at least 0.15.(d) The average donation to the American Lung Association is no more than $10.(e) Residents in suburban Richmond commute, on the average, 15 kilometers to their place of employmentarrow_forwardThe proportion of mango trees on an island that produce only dwarf fruit is p1. The proportion of mango trees on a different island that produce only dwarf fruit is p2. What is the null hypothesis for a test to determine if the proportions are different between the two islands? Select the correct answer below: H0: p1−p2≠0 H0: p1−p2=0 H0: p1−p2>0 H0: p1−p2<0arrow_forwardMatch each Test Situation with the correct Critical Value. For a two-sided test, find only the positive value. Test Situation One sample, n = 35, Ha:p≠p0 , and α= 0.001______ One sample, n = 45, Ha:p<p0, and α= 0.01_______ One sample, n = 61, Ha:p>p0, and α= 0.05_____ One sample, σσ is unknown, n = 57, Ha:μ<μ0, and α= 0.05_____ One sample, σ is unknown, n = 47, Ha:μ≠μ0, and α = 0.05___ One sample, σ is known, n = 175, Ha:μ≠μ0, and α= 0.05___ One sample, σ is unknown, n = 37, Ha:μ>μ0 and α = 0.01____ Critical Value 3.291 2.434 -1.673 1.645 2.013 -2.326 1.960arrow_forward
- Maria has two routes, E and W, she can take when commuting to work. Both routes go through a railroad crossing, and sometimes she needs to stop at the crossing to allow trains to pass. She claims that the proportion of times she needs to stop when taking route E is different from the proportion of times she needs to stop when taking route W. She conducted the following hypothesis test at the significance level of α=0.10. H0:pE=pWHa:pE≠pW In the hypotheses, pE represents the proportion of times she needs to stop at the crossing when using route E, and pWrepresents the proportion of times she needs to stop at the crossing when using route W. All conditions for inference were met, and the resulting p-value was 0.37. Which of the following is the correct decision for the test? The p-value is less than α, and the null hypothesis is rejected. There is convincing evidence to support the claim that the proportion of times she needs to stop at the crossing is different for the…arrow_forwardAmateur triathletes who competed in the 2019 Lake Placid Ironman were classified by age and satisfaction with the race course with the following results: 18 to 34 35 to 49 50 to 79 Satisfied 570 755 165 Dissatisfied 120 140 118 Do these data provide sufficient evidence at the 0.05 level of significance to conclude that age and satisfaction are independent? Use the Critical Value Method of Testing. In your work space below, you will need to have -1. The null hypothesis, Ho 2. The alternative hypothesis, H1 3. The expected frequencies for each table value 4. The test statistic 5. The critical value 6. The decision to accept Ho or reject Hoarrow_forwardThe manufacturer of a certain engine treatment claims that if you add their product to your engine, it will be protected from excessive wear. An infomercial claims that a woman drove 3 hours without oil, thanks to the engine treatment. A magazine tested engines in which they added the treatment to the motor oil, ran the engines, drained the oil, and then determined the time until the engines seized. Complete parts (a) and (b) below. (a) Determine the null and alternative hypotheses that the magazine will test. UpperH0: ▼ muμ sigmaσ pp ▼ not equals≠ less than< greater than> equals= 3 Upper H1: ▼ muμ sigmaσ pp ▼ not equals≠ equals= less than< greater than> 3 (b) Both engines took exactly 17 minutes to seize. What conclusion might the magazine make based on this evidence? A. The infomercial's claim is true. The Informericial not truearrow_forward
 MATLAB: An Introduction with ApplicationsStatisticsISBN:9781119256830Author:Amos GilatPublisher:John Wiley & Sons Inc
 Probability and Statistics for Engineering and th...StatisticsISBN:9781305251809Author:Jay L. DevorePublisher:Cengage Learning
 Statistics for The Behavioral Sciences (MindTap C...StatisticsISBN:9781305504912Author:Frederick J Gravetter, Larry B. WallnauPublisher:Cengage Learning
 Elementary Statistics: Picturing the World (7th E...StatisticsISBN:9780134683416Author:Ron Larson, Betsy FarberPublisher:PEARSON
 The Basic Practice of StatisticsStatisticsISBN:9781319042578Author:David S. Moore, William I. Notz, Michael A. FlignerPublisher:W. H. Freeman
 Introduction to the Practice of StatisticsStatisticsISBN:9781319013387Author:David S. Moore, George P. McCabe, Bruce A. CraigPublisher:W. H. Freeman