
Videos
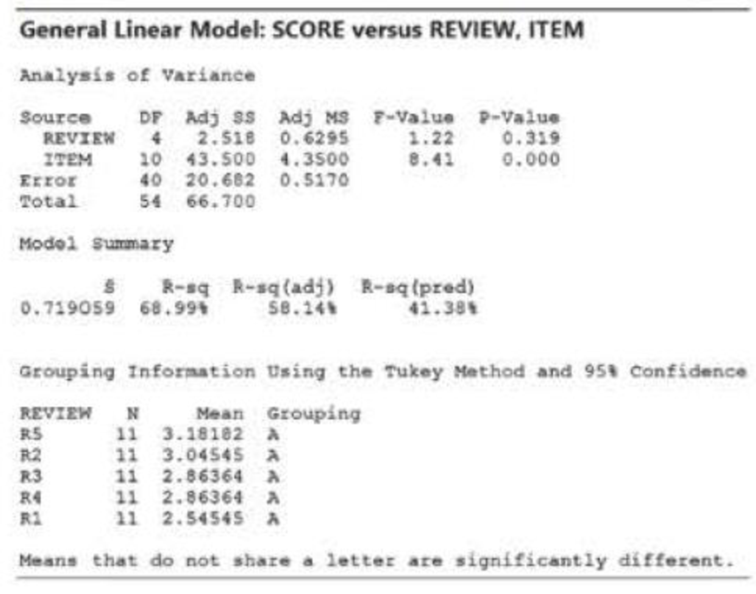
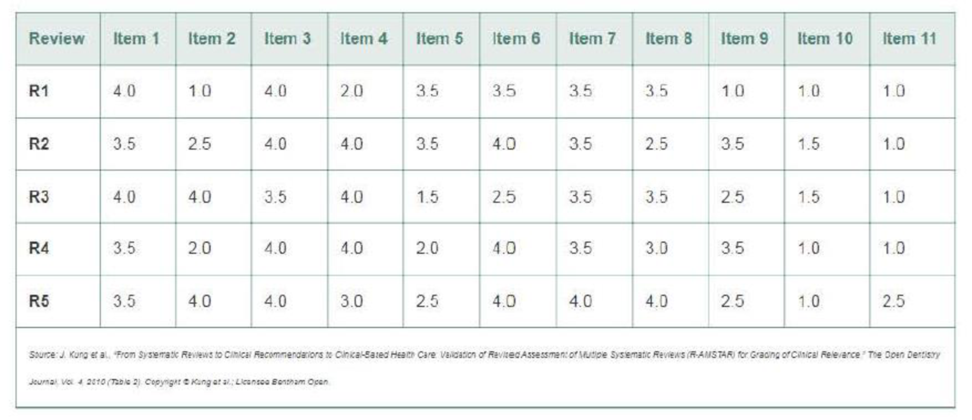
A new method of evaluating health care research reports. When evaluating research reports in health care, a popular tool is the Assessment of Multiple Systematic Reviews (AMSTAR). AMSTAR, which incorporates 11 items (questions), has been widely accepted by professional health associations. A group of dental researchers has revised the assessment tool and named it R-AMSTAR (The Open Dentistry Journal, Vol. 4, 2010). The revised assessment tool was validated on five systematic reviews (named R1, R2, R3, R4. and R5) on rheumatoid arthritis. For each review, scores on the 11 R-AMSTAR items (all measured on a 4-point scale) were obtained. The data are shown in the table at the bottom of the page.
- a. One goal of the study was to compare the mean item scores of the five reviews. Set up the null and alternative hypotheses for this test.
- b. Examine the data in the table and explain why a randomized block ANOVA is appropriate to apply.
- c. The Minitab output for a randomized block ANOVA of the data (with Review as treatments and Item as blocks) appears below. Interpret the p-values of the tests shown.
- d. The Minitab printout also reports the results of a Tukey multiple comparison analysis of the five Review means. Which pairs of means are significantly different? Do these results agree with your conclusion in part c?
- e. The experimentwise error rate used in the analysis of part d is .05. Interpret this value.
Data for Exercise 9.59
Want to see the full answer?
Check out a sample textbook solution
Chapter 9 Solutions
Statistics For Business And Economics, University Of Connecticut


- A psychologist at a private mental health facility was asked to determine whether there was a clear difference in the length of stay for patients with different categories of diagnosis. Looking at the last seven patients in each of the three major categories, the results (in terms of weeks of stay) were as follows. Using the data below, test whether the length of stay for patients vary based on category of diagnosis. Diagnosis Category Affective Disorders Cognitive Disorders Drug-related Conditions 7 12 8 6 8 10 5 9 12 6 11 10 9 11 9 5 10 11 6 9 12 The above scenario requires a one-way Anova, with a bar graph. Question - I need to write an explanation for the output given. I am to include a statistical notation and explanation as to whether the results are significant or not significant. Examples of Explanation: Non-significant:A One-Way ANOVA was conducted to examine whether a preceding situation (watching a…arrow_forwardA psychologist at a private mental health facility was asked to determine whether there was a clear difference in the length of stay for patients with different categories of diagnosis. Looking at the last seven patients in each of the three major categories, the results (in terms of weeks of stay) were as follows. Using the data below, test whether the length of stay for patients vary based on category of diagnosis. Diagnosis Category Affective Disorders Cognitive Disorders Drug-related Conditions 7 12 8 6 8 10 5 9 12 6 11 10 9 11 9 5 10 11 6 9 12 Statistics is a harder subject for me, so any further explanation is appreciated. I am needing the appropriate output for this scenario. I have determined that a Repeated measures ANOVA is needed, including post hoc test results, as well as a bar chart for this output. I need to Present the results, including statistical notations. My analysis also requires…arrow_forwardRecently airlines have cut services, such as meals and snacks during flights, and started charging extra for some services, such as accommodating overweight luggage, last-minute flight changes, and pets traveling in the cabin. However, they are still concerned about service. Recently, a group of four carriers hired Brunner Marketing Research Inc. to survey passengers regarding their level of satisfaction with a recent flight. The survey included questions on ticketing, boarding, in-flight service, baggage handling, pilot communication, and so forth. Twenty-five questions offered a range of possible answers: excellent, good, fair, or poor. A response of excellent was given a score of 4, good a 3, fair a 2, and poor a 1. These responses were then totaled, so the total score was an indication of the satisfaction with the flight. The greater the score, the higher the level of satisfaction with the service. The highest possible score was 100. Brunner randomly selected and surveyed…arrow_forward
- In a study of three nationally representative large- scale data sets from Ireland, the United States, and the United Kingdom (n = 17,247), teenagers between the ages of 12 to 15 were asked to keep a diary of their screen time and answer questions about how they felt or acted. Identify the explanatory variables. Comment on wheter the results of the study can be generalized to the population and whyarrow_forwardThree types of medium sized cars assembled in New Zealand have been test driven by a motoring magazine and compared on a variety of criteria. In the area of fuel efficiency performance, five cars of each brand were each test driven 1000 km; the km per litre data are obtained as follows (kilometres per litre): Brand A (7.6; 8.4; 8.0; 7.6; 8.4). Brand B (7.8; 8.0; 9.1; 8.5; 9.6). Brand C (9.6; 10.4; 9.2; 9.7; 10.6). SSE = 4.26 and TSS = 13.693. what is the critical value at 5% significance levelarrow_forwardThree types of medium sized cars assembled in New Zealand have been test driven by a motoring magazine and compared on a variety of criteria. In the area of fuel efficiency performance, five cars of each brand were each test driven 1000 km; the km per litre data are obtained as follows (kilometres per litre): Brand A (7.6; 8.4; 8.0; 7.6; 8.4). Brand B (7.8; 8.0; 9.1; 8.5; 9.6). Brand C (9.6; 10.4; 9.2; 9.7; 10.6). SSE = 4.26 and TSS = 13.693. What is the value of the F-statistic (rounded off 2 decimals)?arrow_forward
- A consumer group is investigating a producer of diet meals to examine if its prepackaged meals actually contain the advertised 6 ounces of protein in each package. Based on the following data, is there any evidence that the meals do not contain the advertised amount of protein? Run the appropriate test at a 5% level ofarrow_forwardAs a researcher for the EPA, you have been asked to determine if the air quality in the UnitedStates has changed over the past 2 years. You select a random sample of 10 metropolitan areasand find the number of days each year that the areas failed to meet acceptable air quality Based on the data, answer the following questions.1. What is the purpose of the study?2. Are the samples independent or dependent?3. What hypotheses would you use?4. What is (are) the critical value(s) that you would use?5. What statistical test would you use?6. How many degrees of freedom are there?7. What is your conclusion?8. Could an independent means test have been used?9. Do you think this was a good way to answer the original question?arrow_forwardWhat is the most appropriate data collection method for each of the following research questions? How do consumers in South Dakota feel about Christmas shopping? How do J.C. Penney customers feel about J.C. Penney’s customer service? What is the opinion of S. consumers toward a Chrysler advertisement that questions the quality of Japanese cars? How many people nationwide currently live in apartments? How do Sears-charge customers view the company’s new pricing policy?arrow_forward
- To determine a target audience for a new email package, a computer company surveyed a large random sample of potential customers, asking each whether he/she uses email on a regular basis. (The company considered "a regular basis" to be at least three times a week.) The data, as summarized in the contingency table below, were classified according to two variables: the age of the respondent ("under 18", "18-35", "36-54", "55+") and regularity of email use ("on a regular basis" or "not on a regular basis"). Each cell of the table contains three numbers: the first number is the observed cell frequency (fO); the second number is the expected cell frequency (fE) under the assumption that there is no dependence between age and regularity of email use and the third number is the following value.arrow_forwardTo determine a target audience for a new email package, a computer company surveyed a large random sample of potential customers, asking each whether he/she uses email on a regular basis. (The company considered "a regular basis" to be at least three times a week.) The data, as summarized in the contingency table below, were classified according to two variables: the age of the respondent ("under 18", "18-35", "36-54", "55+") and regularity of email use ("on a regular basis" or "not on a regular basis"). Each cell of the table contains three numbers: the first number is the observed cell frequency (fO); the second number is the expected cell frequency (fE) under the assumption that there is no dependence between age and regularity of email use and the third number is the following value. =−fOfE2fE−Observed cell frequencyExpected cell frequency2Expected cell frequencyarrow_forwardAs an admissions counselor, I am interested in understanding whether or not there is a difference in stress levels not only between different majors but also between different classes (Freshman v. Seniors). I gather the following data from students from three majors (Psychology, Chemistry, and Engineering), that are in their freshmen or senior years and ask them about their stress levels (scale of 1-10, with lower numbers meaning less stress). Using the data below, test whether there are effects of class, major, or an interaction between them at an alpha of 0.05. Psychology Chemistry Engineering Freshmen 3, 4, 4, 2, 4 4, 5, 7, 8, 4 5, 7, 7, 8, 5 Senior 4, 5, 5, 3, 5 8, 5, 6, 7, 7 9, 9, 8, 7, 9 Complete the ANOVA summary table below: Source SS df MS (variance) F MAJOR CLASS MAJOR*CLASS ERROR/RESIDUAL Nothing here TOTAL Nothing here Nothing here What can we conclude?…arrow_forward
 Glencoe Algebra 1, Student Edition, 9780079039897...AlgebraISBN:9780079039897Author:CarterPublisher:McGraw Hill