
Concept explainers
Videos
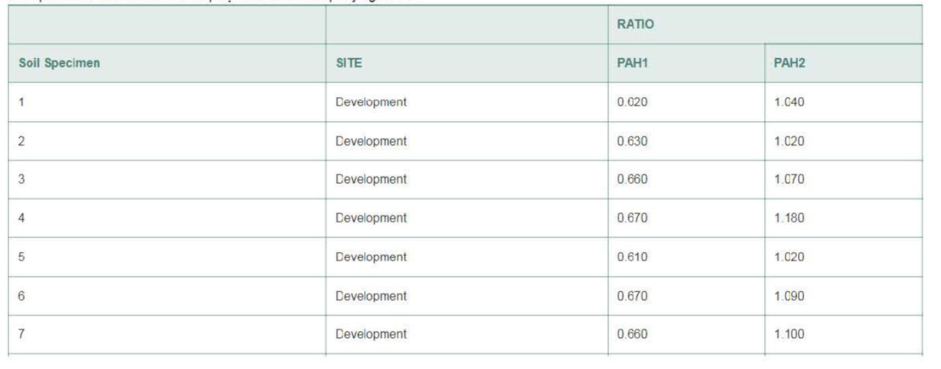
Pollutants at a housing development. Polycyclic aromatic hydrocarbons (PAHs)—formed during the incomplete burning of oil. gas. or coal—are considered to be potential dangerous pollutants by the Environmental Protection Agency (EPA). Consider' an actual developer who purchased a large parcel of land in Florida that he planned to turn into a residential community. Because the parcel turned out to have significant deposits of PAHs, the developer was required to remove these pollutants from the site prior to commencing development. The clean-up was completed, but the housing bubble burst and the development was a bust. The developer blamed the failure of his plan on the discovery of the pollutants, and filed suit against two industries (named Industry A and B) that were within 25 miles of the site. Although both industries produced PAH waste materials as part of their industrial processes, both denied responsibility for the pollution. Experts were hired to investigate the decree of similarity between pollutants at the industrial sites and these at the development site. Soil specimens were collected at each of four locations: 7 at the housing development site, 6 at Industry A, 5 at Industry B, and 2 at Industry C. Two different molecular diagnostic ratios for measuring the level of PAH in soil were determined for each soil specimen. These data are displayed in the accompanying table.

a. A biochemical expert hired by Industry A chose to analyze the data using a series of t-tests for comparing two means. That is, he conducted a two-sample t-test (Section 8.2 ) using α = .05 for each possible pair of sites: Industry A vs. Industry B, Industry A vs. Industry C, Industry A vs. Development, Industry B vs. Industry C. Industry E vs. Development, and Industry C vs. Development. The results of these 6 t-tests for the second PAH ratio variable led the expert to conclude that (1) mean PAH2 ratio at the development site is statistically different from the corresponding mean at Industry A and (2) the mean PAH2 ratio at the development site is not statistically different from the corresponding mean at Industry B. Use the data in the PAH file to replicate these results.
b. The inferences derived in part a led the expert to argue that the source of the PAH contamination at the housing development site is more likely to have been derived from Industry A than from Industry B. A statistician, hired to rebut this testimony, argued that the analysis (and subsequent inference) was flawed. Explain why. multiple t-tests; inflated Type I error rate
c. Propose a better, more statistically valid, method of analyzing the data. Conduct this analysis for both dependent variables. PAH Ratio 1 and PAH Ratio 2. What do you conclude? Run ANOVA
d. According to the statistician s court testimony, “the results provide clear evidence that these samples are simply too small to make a reliable determination about the sites' similarity or dissimilarity with aspect to [PAH] diagnostic ratios.” The statistician went on to conclude that “the small samples relied upon by [the biochemical expert] shed to light on the issue of whether [Industry A and Industry B] are similar or dissimilar to the [development] site” Do you agree? [Concluding Note: The trial judge ultimate y decided that the biochemist’s statistical analyses and his opinions based on them would be excluded from the evidence used to decide the case. As of this date, the issue of responsibility for the pollution has still not been decided ]
Want to see the full answer?
Check out a sample textbook solution
Chapter 9 Solutions
Statistics For Business And Economics, University Of Connecticut


- evaluate (intergration by parts)arrow_forwardA municipal solid-waste site for a city must be located at Site A or Site B. After sorting, some of the solid refuse will be transported to an electric powerplant where it will be used as fuel. Data for the hauling of refuse from each site to the power plant are shown in Table P2-4. If the power plant will pay $8.00 per cubic yard of sorted solid waste delivered to the plant, where should the solid-waste site be located? Use the city’s viewpoint and assume that 200,000 cubic yards of refuse will be hauled to the plant for one year only. One site must be selected.arrow_forwardI want a solution to the attached Quwstion.?arrow_forward
- The Deepwater Horizon oil spill in the Gulf of Mexico on April 20, 2010 was "an environmental disaster of unprecedented proportions" and was a "devastating blow to the resource-dependent economy of the region" [1]. According to the Washington Post, it is estimated that 9857 9857 cubic meters of oil per day spilled into the Gulf of Mexico on August 2, 2010 Assume that an average of 9857 m^3/day of oil spilled into the Gulf of Mexico everyday and that it formed a hemispherical dome of radius r on the ocean floor. D) find the rate of change of the radius with respect to time when the volume of the oil spill is 50,000m^3. E) Since only the oil that is in contact with seawater can mix with seawater, it is important to know how much of the surface area of the oil spill is in contact with seawater. Find the rate of change of the hemisphere's surface area with respect to time when the volume of the oil spill is 50,000 m3. Include units in your answer. You should assume that only the top…arrow_forwardThe Deepwater Horizon oil spill in the Gulf of Mexico on April 20, 2010 was "an environmental disaster of unprecedented proportions" and was a "devastating blow to the resource-dependent economy of the region" [1]. According to the Washington Post, it is estimated that 9857 9857 cubic meters of oil per day spilled into the Gulf of Mexico on August 2, 2010 Assume that an average of 9857 m^3/day of oil spilled into the Gulf of Mexico everyday and that it formed a hemispherical dome of radius r on the ocean floor. A) find a formula for the volume of oil spilled in cubic meters, t days after the start of the oil spill. Include units in answer B) find the derivative of volume formula with respect to time. Include units in answer. C) when the volume of the oil spill is 50,000m^3, what is the radius of the hemisphere of oil? Include units in your answer. Give your answer accurate to 3 decimal places. D) find the rate of change of the radius with respect to time when the volume of…arrow_forwardPlagrisam highly disagreearrow_forward
- Further to the information provided in the question above, we are informed that nails produced thatare shorter than the minimum acceptable length have to be scrapped. Consider that 4.8cm is still theminimum threshold for acceptable nail length. If the cost to produce one nail is 45 cents, how muchdoes the company incur in Rand losses due to scrapping?arrow_forwardI want example of last-come first-served (LCFS)arrow_forwarduse the appropriate method of intergration to solve the question belowarrow_forward
 MATLAB: An Introduction with ApplicationsStatisticsISBN:9781119256830Author:Amos GilatPublisher:John Wiley & Sons Inc
 Probability and Statistics for Engineering and th...StatisticsISBN:9781305251809Author:Jay L. DevorePublisher:Cengage Learning
 Statistics for The Behavioral Sciences (MindTap C...StatisticsISBN:9781305504912Author:Frederick J Gravetter, Larry B. WallnauPublisher:Cengage Learning
 Elementary Statistics: Picturing the World (7th E...StatisticsISBN:9780134683416Author:Ron Larson, Betsy FarberPublisher:PEARSON
 The Basic Practice of StatisticsStatisticsISBN:9781319042578Author:David S. Moore, William I. Notz, Michael A. FlignerPublisher:W. H. Freeman
 Introduction to the Practice of StatisticsStatisticsISBN:9781319013387Author:David S. Moore, George P. McCabe, Bruce A. CraigPublisher:W. H. Freeman