
Concept explainers
Videos
In some cases, users want to use Access and Excel together. They process relational data with Access, import some of the data into Excel, and use Excel’s tools for creating professional-looking charts and graphs. You will do exactly that in this exercise.
FIGURE AE-3 Data Displayed in Pie-Chart Format
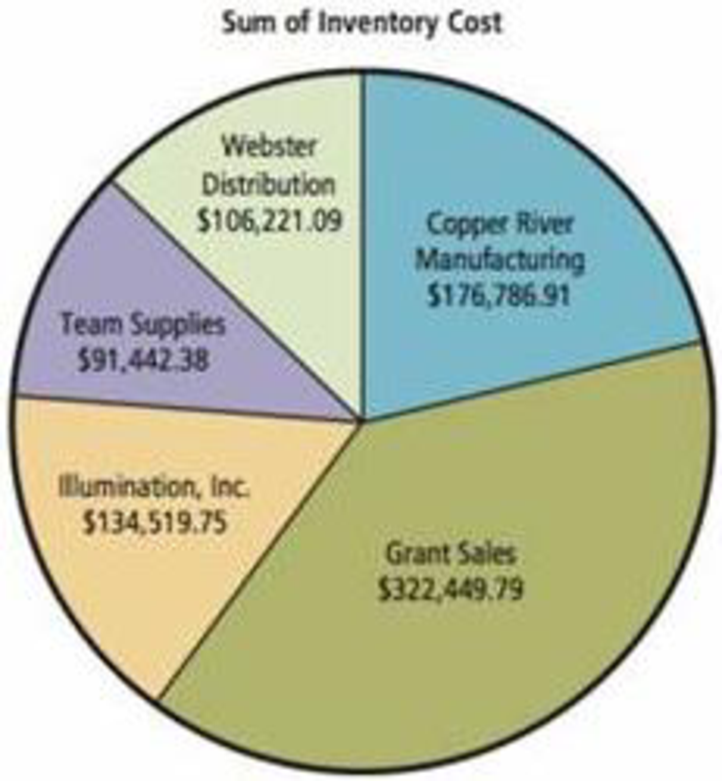
Source: Microsoft Corporation
Download the Access file Ch05Ex01_U10e.accdb. Open the
For this problem, we will define InventoryCost as the product of Industry-Standard-Cost and QuantityOnHand. The query InventoryCost computes these values for every item in inventory for every vendor. Open that query and view the data to be certain you understand this computation. Open the other queries as well so that you understand the data they produce.
- a. Sum this data by vendor and display it in a pie chart like that shown in Figure AE-3 (your totals will be different from those shown). Proceed as follows:
- (1) Open Excel and create a new spreadsheet.
- (2) Click DATA on the ribbon and select From Access in the Get External Data ribbon category.
- (3) Navigate to the location in which you have stored the Access file Ch05Ex01_U10e.accdb.
- (4) Select the query that contains the data you need for this pie chart.
- (5) Import the data into a worksheet.
- (6) Format the appropriate data as currency.
- (7) Select the range that contains the data, press the Function key, and proceed from there to create the pie chart. Name the data and pie chart worksheets appropriately.
h. Follow a similar procedure to create the bar chart shown in Figure AE-4. Again, your data will be different. Place the data and the chart in separate worksheets and name them appropriately.
FIGURE AE-4 Data Displayed in Bar-Chart Format
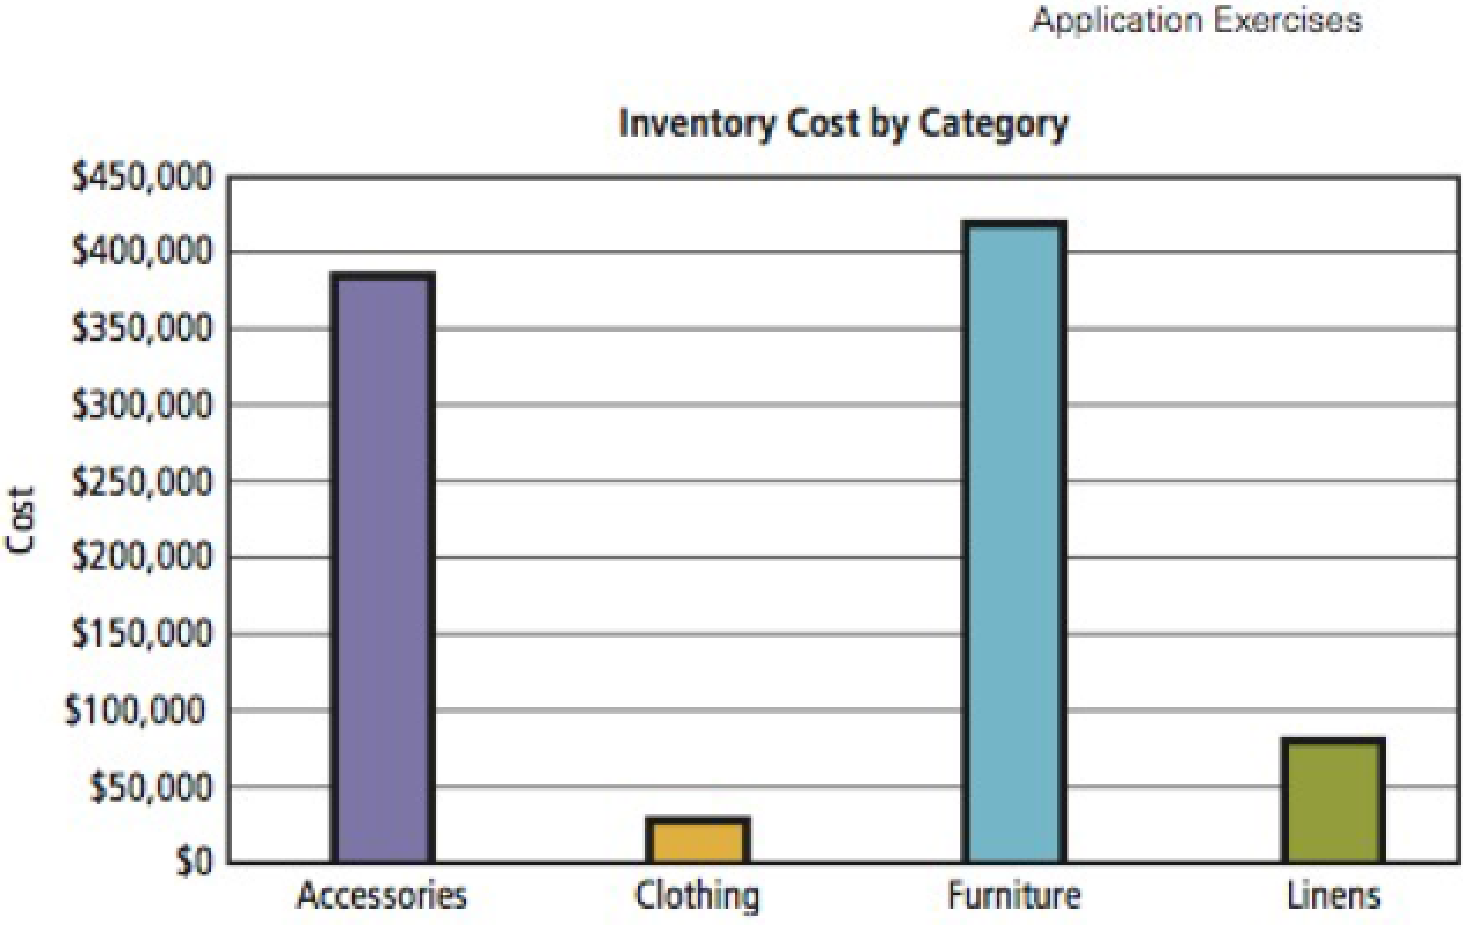
Source: Microsoft Corporation
Want to see the full answer?
Check out a sample textbook solution
Chapter AE Solutions
Using MIS (10th Edition)
Additional Engineering Textbook Solutions
Starting Out With Visual C# (5th Edition)
Software Engineering (10th Edition)
Starting Out With Visual Basic (7th Edition)
Starting Out with C++: Early Objects
Java How to Program, Early Objects (11th Edition) (Deitel: How to Program)


- Which one is the key data model in SQLite? ( ) ER model. ( ) Network data model. ( ) Object-oriented data model. ( ) Relational data model. A DBMS contains components such as ________. ( ) Query processor, DDL compiler, and database manager ( ) DML preprocessor, system buffers, and file manager ( ) Application programs, ER diagram wrapper, catalog manager ( ) Database manager, dictionary manager, system access methodsarrow_forwardthis is an ITSE 2356 COURSE ,we use Iggy fernandez and Bob Bryla as a reference : Case: As of late, there seems to be a perpetual problem with current database table size growth causing performance problems, -- in that you are at a point of daily tablesize management. Task: Develop and preapre a plan that will create a reporting process to monitor database growth.(as part of your submittal - write the suggested SQL queries). Again, this shoud be no less one typed word file. Also recommend the use of Spooling or some other Oracle print process for query submital.arrow_forwardShow T-SQL coding, object explorer and query result, running on SQL Server Management Studio. 1.1 Create a Database named RDD412_SA_YourICASNo. (1) 1.2 Create Six Tables in the database created in question 1.1. As illustrated in the ERD Diagram below. (12) 1.3 The Tables should have the relevant Primary Keys and Foreign Keys. (10) 1.4 Each table should have 5 rows of dummy data per table. (12)arrow_forward
- Referring to Appendix A below, code a MySQL statement to display the sales order number and customer name for all sales orders. APPENDIX A – Table definitions and initializations-- MySQL script to initialize a MySQL database and four tables:-- customer, detail, item, salesorder--DROP DATABASE IF EXISTS finaldb;CREATE DATABASE finaldb;USE finaldb;CREATE TABLE customer ( c_num varchar(16), c_name varchar(128));CREATE TABLE detail ( d_onum varchar(16), d_inum varchar(16), d_qty int);CREATE TABLE item ( i_num varchar(16), i_name varchar(128), i_price decimal(9,2), i_qty int);CREATE TABLE salesorder ( s_num varchar(16), s_cnum varchar(16), s_date date);INSERT INTO customer VALUES ('c101','Sam Paint'), ('c102','Ramon Hardware'), ('c103','Li Auto');--INSERT INTO detail VALUES ('s201','i301',21), ('s201','i302',22), ('s202','i302',23), ('s202','i303',24), ('s203','i303',25), ('s203','i304',26);--INSERT INTO item VALUES…arrow_forward"Mpho is very excited about the new information system to be built for his spaza shop. In this section, you need to make Mpho understand database concepts and how they will benefit his spaza shop." Draw sample tables that would be used in Mpho's information system. Provide the following for the sample database: Table names (Three tables required). Table fields (at least four fields per table). Specify the primary keys for each table. Specify foreign keys wherever applicable. Populate the tables with at least two records.arrow_forwardHelloI hope to answer my question and don't use your handwriting, pleaseThank you Try the answer to be unique with references please Describe two techniques that could be used to tune database schema. Support your answer with at least one example for each techniquearrow_forward
- Hello can you help me make a normalized ERD using the table details from below The database name is Vaccination and there is a table login and table record which is below Thank You very mucharrow_forwardPlease written by computer source There are 2 parts to this assignment Unit 6 - Part 1--Prepare a written paper of at least 1 page describing your business/organization (01-Description) Unit 6 - Part 2--Prepare a relational schema for this business/organization. (Database must contain at least 5 tables or more) (02-Relational Schema) Part 1 - The description of your business/organization paper should answer the following questions; who will use the database(one department, multiple departments, staff, admins, etc...)?, how is data collected presently in the business before your new database design?, how many people will this database serve?, etc... This is the first page of your project wiki. Wikis have been created with your name. You can find the wiki by clicking on the PROJECT WIKIS button on the left side of your Blackboard screen. There is a example of a project under the wikis button that you may find helpful. Wikis are great because you can see each other's work without having…arrow_forwardWe created a database that uses three tables with the online DB Browser for SQLite. Could that have be done using Excel? Explain why or why not.arrow_forward
- The following tables form part of a database held in a relational DBMS: Hotel (h) hotelNo, hotelName, cityRoom (r) roomNo, hotelNo, type, priceBooking (b) bookingNo, hotelNo, guestNo, dateFrom, dateTo, roomNoGuest (g) guestNo, guestName, guestAddress where the bolded attributes are the primary keys for the respective tables. Using theabove tables, answer the following questions: 1. Create a view containing the hotel name and the names of the guests staying at the hotel. 2. Create a view containing the account for each guest at the Grosvenor Hotel. 3. Give the user Manager full access to the above 2 views, with the privilege to pass the access on to other users. 4. Create a separate table with the same structure as the Booking table to hold archive records. 5. Using the INSERT statement, copy the records from the Booking table to the archive table relating to bookings before 1st January 2021. 6. Delete all bookings before 1st January 2021 from the Booking table.arrow_forward1. Which tool is commonly used for administering and managing SQL Server databases?A) SQL Server Integration Services (SSIS)B) SQL Server Reporting Services (SSRS)C) SQL Server Management Studio (SSMS)D) SQL Server Analysis Services (SSAS)2. What is the primary purpose of SQL Server Profiler in SSMS?A) To design database schemasB) To manage database backupsC) To monitor and capture database events and queriesD) To optimize SQL queries3. In SSMS, which option allows you to generate a script to backup a SQL Server database?A) Database DiagramsB) Object ExplorerC) Query EditorD) Maintenance Plans4. Which SQL Server feature in SSMS helps you track changes to database tables, such as inserts, updates, anddeletes?A) SQL Server ProfilerB) SQL Server AgentC) Change Data Capture (CDC)D) Extended EventsADI632 – Formative Assessment 3 Semester 2 Paper 2023 | V1.0 Page 4 of 65. In SSMS, which performance monitoring tool provides real-time information about SQL Server instances and their…arrow_forwardAll of you must be familier with human resources system (employee database). Soplease design database for a human resources system that at least has 4 entitiesinvolved and for the 4 entities please do the following:a. Create the tables that conform to 3NF.b. Draw the Crow’s Foot ERD to reflect the dependency and relationshipdiagrams;c. For all entities/tables created please write the MASTER and TRANSACTIONdata accordingly!d. Use SQL commands to to do selection which involve 1 table, 2 tables, and 3tables.arrow_forward
 Database System ConceptsComputer ScienceISBN:9780078022159Author:Abraham Silberschatz Professor, Henry F. Korth, S. SudarshanPublisher:McGraw-Hill Education
 Starting Out with Python (4th Edition)Computer ScienceISBN:9780134444321Author:Tony GaddisPublisher:PEARSON
 Digital Fundamentals (11th Edition)Computer ScienceISBN:9780132737968Author:Thomas L. FloydPublisher:PEARSON
 C How to Program (8th Edition)Computer ScienceISBN:9780133976892Author:Paul J. Deitel, Harvey DeitelPublisher:PEARSON
 Database Systems: Design, Implementation, & Manag...Computer ScienceISBN:9781337627900Author:Carlos Coronel, Steven MorrisPublisher:Cengage Learning
 Programmable Logic ControllersComputer ScienceISBN:9780073373843Author:Frank D. PetruzellaPublisher:McGraw-Hill Education