
Concept explainers
Videos
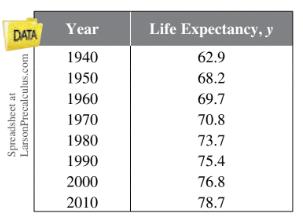
Population Statistics The table shows the life expectancies of a child (at birth) in the United States for selected years from 1940 through 2010.
A model for the life expectancy during this period is
Where y represents the life expectancy and t is the time in years, with t = 0 corresponding to 1940.
(a) Use a graphing utility to graph the data from the table and the model in the same
viewing window. How well does the model fit the data? Explain.
(b) Determine the life expectancy in 1990 both graphically and algebraically.
(c) Use the graph to determine the year when life expectancy was approximately 70.1.
verify your answer algebraically.
(d) Find the y-intercept of the graph of the model. What does it represent in the context
of the problem?
(e) Do you think this model can be used to predict the life expectancy of a child 50
years from now?
Want to see the full answer?
Check out a sample textbook solution
Chapter P Solutions
WebAssign Printed Access Card for Larson's Trigonometry, 10th Edition, Single-Term


- Projectile Motion In Exercises 75 and 76, consider the path of an object projected horizontally with a velocity of v feet per second at a height of s feet, where the model for the path is x2=v216ys. In this model (in which air resistance is disregarded), y is the height (in feet) of the projectile and x is the horizontal distance (in feet) the projectile travels. A ball is thrown from the top of a 100-foot tower with a velocity of 28 feet per second. (a) Write an equation for the parabolic path. (b) How far does the ball travel horizontally before it strikes the ground?arrow_forwardMaximum Sales Growth This is a continuation of Exercise 10. In this exercise, we determine how the sales level that gives the maximum growth rate is related to the limit on sales. Assume, as above, that the constant of proportionality is 0.3, but now suppose that sales grow to a level of 4 thousand dollars in the limit. a. Write an equation that shows the proportionality relation for G. b. On the basis of the equation from part a, make a graph of G as a function of s. c. At what sales level is the growth rate as large as possible? d. Replace the limit of 4 thousand dollars with another number, and find at what sales level the growth rate is as large as possible. What is the relationship between the limit and the sales level that gives the largest growth rate? Does this relationship change if the proportionality constant is changed? e. Use your answers in part d to explain how to determine the limit if we are given sales data showing the sales up to a point where the growth rate begins to decrease.arrow_forwardPopulation Statistics The table shows the life expectancies of a child (at birth) in the United States for selected years from 1940 through 2010. A model for the life expectancy during this period is y=63.6+0.97t1+0.01t,0r70 Where y represents the life expectancy and t is the time in years, with t=0 corresponding to 1940. (a) Use a graphing utility to graph the data from the table and the model in the same viewing window. How well does the model fit the data? Explain (b) Determine the life expectancy in 1990 both graphically and algebraically. (c) Use the graph to determine the year when life expectancy was approximately 70.1. Verify your answer algebraically. (d) Identify the y-intercept of the graph of the model. What does it represent in the context of the problem? (e) Do you think this model can be used to predict the life expectancy of a child 50 years from now? Explainarrow_forward
 Trigonometry (MindTap Course List)TrigonometryISBN:9781337278461Author:Ron LarsonPublisher:Cengage Learning
 Functions and Change: A Modeling Approach to Coll...AlgebraISBN:9781337111348Author:Bruce Crauder, Benny Evans, Alan NoellPublisher:Cengage Learning
 Algebra & Trigonometry with Analytic GeometryAlgebraISBN:9781133382119Author:SwokowskiPublisher:Cengage
 College AlgebraAlgebraISBN:9781305115545Author:James Stewart, Lothar Redlin, Saleem WatsonPublisher:Cengage Learning