
Concept explainers
Videos
(a)
To graph :The
(b)
To graph :The function
( c )
To graph :The function
( d )
To graph :The function
( e )
To graph :The function
( e )
To graph :The function

Trending nowThis is a popular solution!

Chapter P Solutions
WebAssign Printed Access Card for Larson's Trigonometry, 10th Edition, Single-Term


- Temperature An object at a temperature of 160C was removed from a furnace and placed in a room at 20C. The temperature T of the object was measured each hour h and recorded in the table. A model for the data is T=20+140e0.68h (a)The figure below shows the graph of the model. Use the graph to identify the horizontal asymptote of the model and interpret the asymptote in the context of the problem. (b) Use the model to approximate the time it took for the object to reach a temperature of 100C.arrow_forwardTemperature An object at a temperature of 160C was removed from a furnace and placed in a room at 20C. The temperature T of the object was measured each hour h and recorded in the table. A model for the data is T=20+140e0.68h. (a) The figure below shows the graph of the model. Use the graph to identify the horizontal asymptote of the model and interpret the asymptote in the context of the problem. (b) Use the model to approximate the time it took for the object to reach a temperature of 100C.arrow_forwardFocusing Distance For a camera with a lens of fixed focal length F to focus on an object located a distance x from the lens, the film must be placed a distance y behind the lens, where F, x, and y are related by 1x+1y=1F See the figure. Suppose the camera has a 55-mm lens F=55. a Express y as a function of x, and graph the function. b What happens to the focusing distance y as the object moves far away from the lens? c What happens to the focusing distance y as the object moves close to the lens?arrow_forward
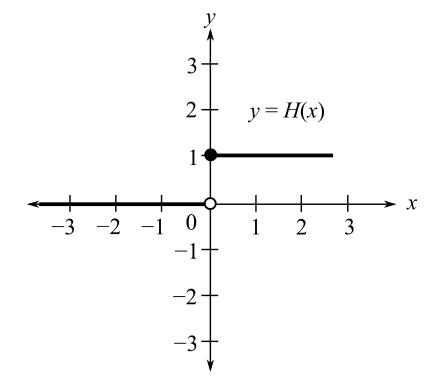
- Weather Balloon As a weather balloon is inflated, the thickness T of its rubber skin is related to the radius of the balloon by T(r)=0.5r2 where T and r are measured in centimeters. Graph the function T for values of r between 10 and 100.arrow_forwardBungee Jumping Luisa goes bungee jumping from a 500-ft-high bridge. The graph shows Luisas height ht in ft after t seconds. Describe in words what the graph indicates about Luisas bungee jump. Suppose Luisa goes bungee jumping from a 400-ft-high bridge. Sketch a new graph that shows Luisas height Ht after t seconds. What transformation must be performed on the function h to obtain the function H? Express the function H in terms of h.arrow_forwardHeaviside Function The Heaviside function hx=1,x00,x0 is widely used in engineering applications. (See figure.) To print an enlarged copy of the graph, go to MathGraphs.com. Sketch the graph of each function by hand. aHx2 bHx2 cHx dHx e12Hx fHx2+2arrow_forward
 Trigonometry (MindTap Course List)TrigonometryISBN:9781337278461Author:Ron LarsonPublisher:Cengage Learning
 College AlgebraAlgebraISBN:9781305115545Author:James Stewart, Lothar Redlin, Saleem WatsonPublisher:Cengage Learning
 Algebra and Trigonometry (MindTap Course List)AlgebraISBN:9781305071742Author:James Stewart, Lothar Redlin, Saleem WatsonPublisher:Cengage Learning
 Glencoe Algebra 1, Student Edition, 9780079039897...AlgebraISBN:9780079039897Author:CarterPublisher:McGraw Hill
 Algebra & Trigonometry with Analytic GeometryAlgebraISBN:9781133382119Author:SwokowskiPublisher:Cengage