
Concept explainers
Videos
Temperature The table shows the temperatures y (in degrees Fahrenheit) in a city over a 24-hour period. Let x represent the time of day, where x = 0 corresponds to 6 a.m.
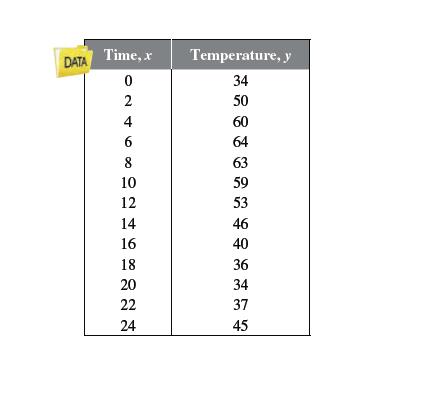
These data can be approximated by the model
Use a graphing utility to create a scatter plot of the data. Then graph the model in the
same viewing window.
How well does the model fit the data?
Use the graph to approximate the times when the temperature was increasing and
decreasing.
Use the graph to approximate the maximum and minimum temperatures during this
24-hour period.
Could this model predict the temperatures in the city during the next 24-hour period?
Why or why not?

Trending nowThis is a popular solution!

Chapter P Solutions
WebAssign Printed Access Card for Larson's Trigonometry, 10th Edition, Single-Term


- Population Statistics The table shows the life expectancies of a child (at birth) in the United States for selected years from 1940 through 2010. A model for the life expectancy during this period is y=63.6+0.97t1+0.01t,0t70 Where y represents the life expectancy and t is the time in years, with t = 0 corresponding to 1940. (a) Use a graphing utility to graph the data from the table and the model in the same viewing window. How well does the model fit the data? Explain. (b) Determine the life expectancy in 1990 both graphically and algebraically. (c) Use the graph to determine the year when life expectancy was approximately 70.1. verify your answer algebraically. (d) Find the y-intercept of the graph of the model. What does it represent in the context of the problem? (e) Do you think this model can be used to predict the life expectancy of a child 50 years from now?arrow_forwardThe table shows the temperatures y (in degrees Fahrenheit) in a city over a 24-hour period. Let x represent the time of day, where x=0 corresponds to 6 a.m. These data can be approximated by the model y=0.026x31.03x2+10.2x+34,0x24. (a) Use a graphing utility to create a scatter plot of the data. Then graph the model in the same viewing window. (b) How well does the model fit the data? (c) Use the graph to approximate the times when the temperature was increasing and decreasing. (d) Use the graph to approximate the maximum and minimum temperatures during this 24-hour period. (e) Could this model predict the temperatures in the city during the next 24-hour period? Why or why not?arrow_forwardPopulation Statistics The table shows the life expectancies of a child (at birth) in the United States for selected years from 1940 through 2010. A model for the life expectancy during this period is y=63.6+0.97t1+0.01t,0r70 Where y represents the life expectancy and t is the time in years, with t=0 corresponding to 1940. (a) Use a graphing utility to graph the data from the table and the model in the same viewing window. How well does the model fit the data? Explain (b) Determine the life expectancy in 1990 both graphically and algebraically. (c) Use the graph to determine the year when life expectancy was approximately 70.1. Verify your answer algebraically. (d) Identify the y-intercept of the graph of the model. What does it represent in the context of the problem? (e) Do you think this model can be used to predict the life expectancy of a child 50 years from now? Explainarrow_forward
- Measurement Use the fact that 13 inches is approximately the same length as 33 centimeters to find a mathematical model that relates centimeters y to inches x. Then use the model to find the numbers of centimeters in 10 inches and 20 inches.arrow_forwardMeasurement Use the fact that 14 gallons is approximately the same amount as 53 liters to find a mathematical model that relates liters y to gallons x. Then use the model to find the numbers of liters in 5 gallons and 25 gallons.arrow_forwardPopulation The population y (in thousands) of Buffalo, New York, from 2000 to 2014 can be approximated by the model y=2.60t+291.7,0t14, where t represents the year, with t=0 corresponding to 2000 (see figure). (a) Graphically estimate the y-intercept of the graph. (b) Find algebraically and interpret the y-intercept of the graph. (c) Use the model to predict the year in which the population will be 239,000. Does your answer seem reasonable? Explain.arrow_forward
- Population The population y (in thousands) of Raleigh, North Carolina, from 2000 to 2014 can be approximated by the model y=11.09t+293.4,0t14, where t represents the year, with t=0 corresponding to 2000 (see figure). (a) Graphically estimate the y-intercept of the graph. (b) Find algebraically and interpret the y-intercept of the graph. (c) Use the model to predict the year in which the population will be 538,000. Does your answer seem reasonable? Explain.arrow_forwardBaking a Potato: A potato is placed in a preheated oven to bake. Its temperature P=P(t) is given by P=400325et/50, Where P is measured in degrees Fahrenheit and t is the time in minutes since the potato was placed in the oven. a. Make a graph of P versus t.Suggestion: in choosing your graphing window, it is reasonable to look at the potato over no more than a 2-hour period. After that, it will surely be burned to a crisp. You may wish to look at a table of values to select a vertical span. b. What was the initial temperature of the potato? c. Did the potatos temperature rise more during the first 30 minutes or second 30 minutes of baking? What was the average rate of change per minute during the first 30 minutes? What was the average rate of change per minute during the second 30 minutes. d. Is this graph concave up or concave down? Explain what that tells you about how the potato heats up, and relate this to part c.. e. The potato will be done when it reaches a temperature of 270 degrees. Approximate the time when the potato will be done. f. What is the temperature of the oven? Explain how you got your answer. Hint: if the potato were left in the oven for a long time, its temperature would match that of the oven.arrow_forward
 Trigonometry (MindTap Course List)TrigonometryISBN:9781337278461Author:Ron LarsonPublisher:Cengage Learning
 Functions and Change: A Modeling Approach to Coll...AlgebraISBN:9781337111348Author:Bruce Crauder, Benny Evans, Alan NoellPublisher:Cengage Learning
 College AlgebraAlgebraISBN:9781305115545Author:James Stewart, Lothar Redlin, Saleem WatsonPublisher:Cengage Learning
 Algebra & Trigonometry with Analytic GeometryAlgebraISBN:9781133382119Author:SwokowskiPublisher:Cengage
 College Algebra (MindTap Course List)AlgebraISBN:9781305652231Author:R. David Gustafson, Jeff HughesPublisher:Cengage Learning