
Concept explainers
Videos
HOW DO YOU SEE IT? Match the description of the situation with its graph. Also determine the slope and y-intercept of each graph and interpret the slope and y-intercept in the context of the situation. [The graphs are labeled (i), (ii), (iii), and (iv).]
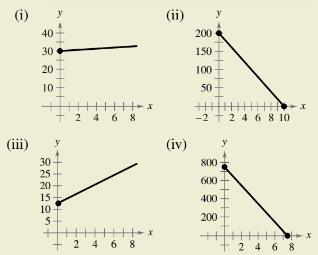
(a) A person is paying
(b) An employee receives
(c) A sales representative receives
(d) A computer that was purchased for
Want to see the full answer?
Check out a sample textbook solution
Chapter P Solutions
Trigonometry (MindTap Course List)


- Geometry The length and width of a rectangular garden are 15 meters and 10 meters, respectively. A walkway of width x surrounds the garden. (a) Draw a diagram that gives a visual representation of the problem. (b) Write the equation for the perimeter y of the walkway in terms of x. (c) Use a graphing utility to graph the equation for the perimeter. (d) Determine the slope of the graph in part (c). For each additional one-meter increase in the width of the walkway, determine the increase in its perimeter.arrow_forwardPressure and Depth At the surface of the ocean the water pressure is the same as the air pressure above the water, 15lb/in2. Below the surface the water pressure increases by 4.34lb/in2 for every 10ft of descent. Find an equation for the relationship between the pressure and depth below the ocean surface. Sketch a graph of this linear equation. What do the slope and y-intercept of the graph represent? At what depth is the pressure 100lb/in2?arrow_forwardFinding Intercepts Algebraically In Exercises 33-38, find the x - and y -intercepts of the graph of the equation algebraically. y=2x4arrow_forward
- HOW DO YOU SEE IT? In parts (a)-(c) use the graph to determine whether the discriminant of the given equation is positive, zero, or negative. Explain. (a) x22x=0 (b) x22x+1=0 (c) x22x+2=0arrow_forwardPopulation The population y (in thousands) of Raleigh, North Carolina, from 2000 to 2014 can be approximated by the model y=11.09t+293.4,0t14, where t represents the year, with t=0 corresponding to 2000 (see figure). (a) Graphically estimate the y-intercept of the graph. (b) Find algebraically and interpret the y-intercept of the graph. (c) Use the model to predict the year in which the population will be 538,000. Does your answer seem reasonable? Explain.arrow_forward
 Trigonometry (MindTap Course List)TrigonometryISBN:9781337278461Author:Ron LarsonPublisher:Cengage Learning
 Algebra and Trigonometry (MindTap Course List)AlgebraISBN:9781305071742Author:James Stewart, Lothar Redlin, Saleem WatsonPublisher:Cengage Learning
 Big Ideas Math A Bridge To Success Algebra 1: Stu...AlgebraISBN:9781680331141Author:HOUGHTON MIFFLIN HARCOURTPublisher:Houghton Mifflin Harcourt
 College AlgebraAlgebraISBN:9781305115545Author:James Stewart, Lothar Redlin, Saleem WatsonPublisher:Cengage Learning
 Glencoe Algebra 1, Student Edition, 9780079039897...AlgebraISBN:9780079039897Author:CarterPublisher:McGraw Hill