
Key Concept Activity Lab Workbook For Path To College Mathematics
1st Edition
ISBN: 9780134618548
Author: Elayn Martin-Gay
Publisher: PEARSON
expand_more
expand_more
format_list_bulleted
Concept explainers
Videos
Textbook Question
Chapter R.4, Problem 86ES
The following circle graph shows the percent of the types of books available at Midway Memorial Library. use this graph for Exercises 85 through 94. See Example 10.
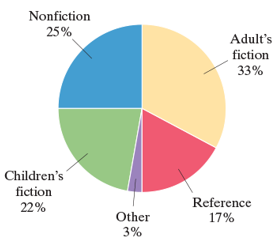
What percent of books are nonfiction or reference?
Expert Solution & Answer
Want to see the full answer?
Check out a sample textbook solution
Students have asked these similar questions
in a pie chart, if a category has a relative frequency of 30%, then its sector takes up 30% of the circle. true or false?
A farmer plants crops on 48 acres of land. The circle graph shows the percentages of land
used for some of the different types of crops.
Land for Crops
Corn
Cotton
40%
Other
10%
Wheat
20%
Based on the circle graph, how many acres of land are used for corn?
Record your answer and fill in the bubbles on your answer document. Be sure to use the
correct place value.
Please hand drove
Chapter R Solutions
Key Concept Activity Lab Workbook For Path To College Mathematics
Ch. R.1 - Represent the shaded part of each geometric figure...Ch. R.1 - Represent the shaded part of each geometric figure...Ch. R.1 - Prob. 3ESCh. R.1 - Represent the shaded part of each geometric figure...Ch. R.1 - Prob. 5ESCh. R.1 - Write each number as product of primes. See...Ch. R.1 - Prob. 7ESCh. R.1 - Write each number as product of primes. See...Ch. R.1 - Write each number as product of primes. See...Ch. R.1 - Prob. 10ES
Ch. R.1 - Prob. 11ESCh. R.1 - Prob. 12ESCh. R.1 - Prob. 13ESCh. R.1 - Prob. 14ESCh. R.1 - Prob. 15ESCh. R.1 - Prob. 16ESCh. R.1 - Prob. 17ESCh. R.1 - Prob. 18ESCh. R.1 - Prob. 19ESCh. R.1 - Prob. 20ESCh. R.1 - Prob. 21ESCh. R.1 - Prob. 22ESCh. R.1 - Prob. 23ESCh. R.1 - Prob. 24ESCh. R.1 - Prob. 25ESCh. R.1 - Prob. 26ESCh. R.1 - Prob. 27ESCh. R.1 - Multiply or divided as indicated. Simplify the...Ch. R.1 - Multiply or divided as indicated. Simplify the...Ch. R.1 - Prob. 30ESCh. R.1 - Prob. 31ESCh. R.1 - Prob. 32ESCh. R.1 - Prob. 33ESCh. R.1 - Prob. 34ESCh. R.1 - Prob. 35ESCh. R.1 - Prob. 36ESCh. R.1 - Prob. 37ESCh. R.1 - Prob. 38ESCh. R.1 - Recall that the area of a plane figure is a...Ch. R.1 - Prob. 40ESCh. R.1 - Prob. 41ESCh. R.1 - Prob. 42ESCh. R.1 - Prob. 43ESCh. R.1 - Add or subtract as indicated. Write the answer in...Ch. R.1 - Prob. 45ESCh. R.1 - Prob. 46ESCh. R.1 - Prob. 47ESCh. R.1 - Prob. 48ESCh. R.1 - Prob. 49ESCh. R.1 - Prob. 50ESCh. R.1 - Prob. 51ESCh. R.1 - Prob. 52ESCh. R.1 - Prob. 53ESCh. R.1 - Prob. 54ESCh. R.1 - Prob. 55ESCh. R.1 - Prob. 56ESCh. R.1 - Prob. 57ESCh. R.1 - Prob. 58ESCh. R.1 - Prob. 59ESCh. R.1 - Prob. 60ESCh. R.1 - Prob. 61ESCh. R.1 - Prob. 62ESCh. R.1 - Prob. 63ESCh. R.1 - Prob. 64ESCh. R.1 - Prob. 65ESCh. R.1 - Prob. 66ESCh. R.1 - Prob. 67ESCh. R.1 - Prob. 68ESCh. R.1 - Prob. 69ESCh. R.1 - Prob. 70ESCh. R.1 - Prob. 71ESCh. R.1 - Prob. 72ESCh. R.1 - Prob. 73ESCh. R.1 - Prob. 74ESCh. R.1 - Prob. 75ESCh. R.1 - Prob. 76ESCh. R.1 - Prob. 77ESCh. R.1 - Mixed Practice Perform the following operations....Ch. R.1 - Prob. 79ESCh. R.1 - Prob. 80ESCh. R.1 - Mixed Practice Perform the following operations....Ch. R.1 - Prob. 82ESCh. R.1 - Prob. 83ESCh. R.1 - Prob. 84ESCh. R.1 - Prob. 85ESCh. R.1 - Mixed Practice Perform the following operations....Ch. R.1 - Prob. 87ESCh. R.1 - Prob. 88ESCh. R.1 - Mixed Practice 121433 Perform the following...Ch. R.1 - Prob. 90ESCh. R.1 - Prob. 91ESCh. R.1 - Prob. 92ESCh. R.1 - Prob. 93ESCh. R.1 - Prob. 94ESCh. R.1 - Prob. 95ESCh. R.1 - Prob. 96ESCh. R.1 - Prob. 97ESCh. R.1 - Prob. 98ESCh. R.1 - Prob. 99ESCh. R.1 - Prob. 100ESCh. R.1 - Prob. 101ESCh. R.1 - Prob. 102ESCh. R.1 - Prob. 103ESCh. R.1 - Prob. 104ESCh. R.1 - Prob. 105ESCh. R.1 - Prob. 106ESCh. R.1 - Prob. 107ESCh. R.1 - Prob. 108ESCh. R.1 - Prob. 109ESCh. R.1 - Prob. 110ESCh. R.2 - Write each decimal as a fraction. Do not simplify....Ch. R.2 - Prob. 2ESCh. R.2 - Prob. 3ESCh. R.2 - Prob. 4ESCh. R.2 - Prob. 5ESCh. R.2 - Prob. 6ESCh. R.2 - Prob. 7ESCh. R.2 - Prob. 8ESCh. R.2 - Prob. 9ESCh. R.2 - Prob. 10ESCh. R.2 - Prob. 11ESCh. R.2 - Prob. 12ESCh. R.2 - Prob. 13ESCh. R.2 - Prob. 14ESCh. R.2 - Prob. 15ESCh. R.2 - Prob. 16ESCh. R.2 - Prob. 17ESCh. R.2 - Prob. 18ESCh. R.2 - Prob. 19ESCh. R.2 - Prob. 20ESCh. R.2 - Prob. 21ESCh. R.2 - Prob. 22ESCh. R.2 - Multiply or divide as indicated. See Example 6 and...Ch. R.2 - Multiply or divide as indicated. See Example 6 and...Ch. R.2 - Mixed Practice Perform the indicated operation....Ch. R.2 - Mixed Practice Perform the indicated operation....Ch. R.2 - Mixed Practice Perform the indicated operation....Ch. R.2 - Mixed Practice Perform the indicated operation....Ch. R.2 - Mixed Practice Perform the indicated operation....Ch. R.2 - Mixed Practice Perform the indicated operation....Ch. R.2 - Mixed Practice 654.956.67 Perform the indicated...Ch. R.2 - Mixed Practice Perform the indicated operation....Ch. R.2 - Mixed Practice Perform the indicated operation....Ch. R.2 - Mixed Practice Perform the indicated operation....Ch. R.2 - Prob. 35ESCh. R.2 - Prob. 36ESCh. R.2 - Mixed Practice Perform the indicated operation....Ch. R.2 - Mixed Practice Perform the indicated operation....Ch. R.2 - Round each decimal to the given place value. See...Ch. R.2 - Round each decimal to the given place value. See...Ch. R.2 - Round each decimal to the given place value. See...Ch. R.2 - Round each decimal to the given place value. See...Ch. R.2 - Round each decimal to the given place value. See...Ch. R.2 - Round each decimal to the given place value. See...Ch. R.2 - Round each decimal to the given place value. See...Ch. R.2 - Round each decimal to the given place value. See...Ch. R.2 - Round each decimal to the given place value. See...Ch. R.2 - Round each decimal to the given place value. See...Ch. R.2 - Write each fraction as a decimal. If the decimal...Ch. R.2 - Write each fraction as a decimal. If the decimal...Ch. R.2 - Write each fraction as a decimal. If the decimal...Ch. R.2 - Write each fraction as a decimal. If the decimal...Ch. R.2 - Write each fraction as a decimal. If the decimal...Ch. R.2 - Write each fraction as a decimal. If the decimal...Ch. R.2 - Write each fraction as a decimal. If the decimal...Ch. R.2 - Write each fraction as a decimal. If the decimal...Ch. R.2 - Write each fraction as a decimal. If the decimal...Ch. R.2 - Write each fraction as a decimal. If the decimal...Ch. R.2 - Concept Extensions Solve. See the Concept Checks...Ch. R.2 - Concept Extensions Solve. See the Concept Checks...Ch. R.2 - Concept Extensions Solve. See the Concept Checks...Ch. R.2 - Concept Extensions Solve. See the Concept Checks...Ch. R.2 - The chart shows the average number of pounds of...Ch. R.2 - The chart shows the average number of pounds of...Ch. R.2 - The following graph is called a circle graph or...Ch. R.2 - The following graph is called a circle graph or...Ch. R.2 - The following graph is called a circle graph or...Ch. R.2 - The following graph is called a circle graph or...Ch. R.2 - The following graph is called a circle graph or...Ch. R.2 - The following graph is called a circle graph or...Ch. R.3 - Solve. See Example 1 and 2. In a survey of 100...Ch. R.3 - Solve. See Example 1 and 2. A basketball player...Ch. R.3 - One hundred adults were asked to name their...Ch. R.3 - One hundred adults were asked to name their...Ch. R.3 - One hundred adults were asked to name their...Ch. R.3 - One hundred adults were asked to name their...Ch. R.3 - Write each percent as a decimal. See Examples 3...Ch. R.3 - Write each percent as a decimal. See Examples 3...Ch. R.3 - Write each percent as a decimal. See Examples 3...Ch. R.3 - Write each percent as a decimal. See Examples 3...Ch. R.3 - Write each percent as a decimal. See Examples 3...Ch. R.3 - Write each percent as a decimal. See Examples 3...Ch. R.3 - Write each percent as a decimal. See Examples 3...Ch. R.3 - Write each percent as a decimal. See Examples 3...Ch. R.3 - Write each percent as a decimal. See Examples 3...Ch. R.3 - Write each percent as a decimal. See Examples 3...Ch. R.3 - Write each percent as a decimal. See Examples 3...Ch. R.3 - Write each percent as a decimal. See Examples 3...Ch. R.3 - Write each percent as a decimal. See Examples 3...Ch. R.3 - Write each percent as a decimal. See Examples 3...Ch. R.3 - Write each percent as a decimal. See Examples 3...Ch. R.3 - Write each percent as a decimal. See Examples 3...Ch. R.3 - Write each percent as a fraction or mixed number...Ch. R.3 - Write each percent as a fraction or mixed number...Ch. R.3 - Write each percent as a fraction or mixed number...Ch. R.3 - Write each percent as a fraction or mixed number...Ch. R.3 - Write each percent as a fraction or mixed number...Ch. R.3 - Write each percent as a fraction or mixed number...Ch. R.3 - Write each percent as a fraction or mixed number...Ch. R.3 - Write each percent as a fraction or mixed number...Ch. R.3 - Write each percent as a fraction or mixed number...Ch. R.3 - Write each percent as a fraction or mixed number...Ch. R.3 - Write each percent as a fraction or mixed number...Ch. R.3 - Write each percent as a fraction or mixed number...Ch. R.3 - Write each percent as a fraction or mixed number...Ch. R.3 - Write each percent as a fraction or mixed number...Ch. R.3 - Write each decimal as a percent. See Examples 13...Ch. R.3 - Write each decimal as a percent. See Examples 13...Ch. R.3 - Write each decimal as a percent. See Examples 13...Ch. R.3 - Write each decimal as a percent. See Examples 13...Ch. R.3 - Write each decimal as a percent. See Examples 13...Ch. R.3 - Write each decimal as a percent. See Examples 13...Ch. R.3 - Write each decimal as a percent. See Examples 13...Ch. R.3 - Write each decimal as a percent. See Examples 13...Ch. R.3 - Write each decimal as a percent. See Examples 13...Ch. R.3 - Write each decimal as a percent. See Examples 13...Ch. R.3 - Prob. 47ESCh. R.3 - Write each decimal as a percent. See Examples 13...Ch. R.3 - Write each decimal as a percent. See Examples 13...Ch. R.3 - Write each decimal as a percent. See Examples 13...Ch. R.3 - Write each fraction or mixed number as a percent....Ch. R.3 - Write each fraction or mixed number as a percent....Ch. R.3 - Write each fraction or mixed number as a percent....Ch. R.3 - Write each fraction or mixed number as a percent....Ch. R.3 - Write each fraction or mixed number as a percent....Ch. R.3 - Write each fraction or mixed number as a percent....Ch. R.3 - Write each fraction or mixed number as a percent....Ch. R.3 - Write each fraction or mixed number as a percent....Ch. R.3 - Write each fraction or mixed number as a percent....Ch. R.3 - Write each fraction or mixed number as a percent....Ch. R.3 - Write each fraction or mixed number as a percent....Ch. R.3 - Write each fraction or mixed number as a percent....Ch. R.3 - Write each fraction or mixed number as a percent....Ch. R.3 - Write each fraction or mixed number as a percent....Ch. R.3 - Write each fraction as a percent. Round to the...Ch. R.3 - Write each fraction as a percent. Round to the...Ch. R.3 - Write each fraction as a percent. Round to the...Ch. R.3 - Write each fraction as a percent. Round to the...Ch. R.3 - Mixed Practice Complete each table. See Example 1...Ch. R.3 - Mixed Practice Complete each table. See Example 1...Ch. R.3 - Mixed Practice Complete each table. See Example 1...Ch. R.3 - Mixed Practice Complete each table. See Example 1...Ch. R.3 - Write each percent as a decimal and a fraction....Ch. R.3 - Write each percent as a decimal and a fraction....Ch. R.3 - Write each percent as a decimal and a fraction....Ch. R.3 - Write each percent as a decimal and a fraction....Ch. R.3 - Write each percent as a decimal and a fraction....Ch. R.3 - Write each percent as a decimal and a fraction....Ch. R.3 - In Exercises 79 through 82, write the percent from...Ch. R.3 - In Exercises 79 through 82, write the percent from...Ch. R.3 - In Exercises 79 through 82, write the percent from...Ch. R.3 - In Exercises 79 through 82, write the percent from...Ch. R.3 - Solve. See Examples 21 and 22. In a particular...Ch. R.3 - Solve. See Examples 21 and 22. The United States'...Ch. R.3 - Solve. See Examples 21 and 22. The mirrors on the...Ch. R.3 - Solve. See Examples 21 and 22. In a particular...Ch. R.3 - Solve. See Examples 21 and 22. The U.S. Postal...Ch. R.3 - Solve. See Examples 21 and 22. In the United...Ch. R.3 - Concept Extensions Solve. See the Concept Checks...Ch. R.3 - Concept Extensions 0.5269, Solve. See the Concept...Ch. R.3 - Concept Extensions Solve. See the Concept Checks...Ch. R.3 - Concept Extensions Solve. See the Concept Checks...Ch. R.3 - Recall that 1=100 This means that 1 whole is 100....Ch. R.3 - Recall that 1=100 This means that 1 whole is 100....Ch. R.3 - What percent of the figure is shaded?Ch. R.3 - What percent of the figure is shaded?Ch. R.3 - Fill in the blanks. A fraction written as a...Ch. R.3 - Fill in the blanks. A decimal written as a percent...Ch. R.3 - Write each fraction as a decimal and then Mite...Ch. R.3 - Write each fraction as a decimal and then Mite...Ch. R.3 - The bar graph shows the predicted fastest-growing...Ch. R.3 - The bar graph shows the predicted fastest-growing...Ch. R.3 - The bar graph shows the predicted fastest-growing...Ch. R.3 - The bar graph shows the predicted fastest-growing...Ch. R.3 - The bar graph shows the predicted fastest-growing...Ch. R.3 - The bar graph shows the predicted fastest-growing...Ch. R.4 - The following pictograph shows the number of acres...Ch. R.4 - The following pictograph shows the number of acres...Ch. R.4 - The following pictograph shows the number of acres...Ch. R.4 - The following pictograph shows the number of acres...Ch. R.4 - Prob. 5ESCh. R.4 - The following pictograph shows the number of acres...Ch. R.4 - The following pictograph shows the number of acres...Ch. R.4 - The following pictograph shows the number of acres...Ch. R.4 - The following pictograph shows the average number...Ch. R.4 - The following pictograph shows the average number...Ch. R.4 - The following pictograph shows the average number...Ch. R.4 - The following pictograph shows the average number...Ch. R.4 - The following pictograph shows the average number...Ch. R.4 - The following pictograph shows the average number...Ch. R.4 - The following pictograph shows the average number...Ch. R.4 - The following pictograph shows the average number...Ch. R.4 - The National Weather Service has exacting...Ch. R.4 - The National Weather Service has exacting...Ch. R.4 - The National Weather Service has exacting...Ch. R.4 - The National Weather Service has exacting...Ch. R.4 - The National Weather Service has exacting...Ch. R.4 - The National Weather Service has exacting...Ch. R.4 - The following horizontal bar graph shows a recent...Ch. R.4 - The following horizontal bar graph shows a recent...Ch. R.4 - The following horizontal bar graph shows a recent...Ch. R.4 - The following horizontal bar graph shows a recent...Ch. R.4 - The following horizontal bar graph shows a recent...Ch. R.4 - The following horizontal bar graph shows a recent...Ch. R.4 - Use the information given to draw a vertical bar...Ch. R.4 - Use the information given to draw a vertical bar...Ch. R.4 - Prob. 31ESCh. R.4 - Prob. 32ESCh. R.4 - The histogram to the right shows the number of...Ch. R.4 - The histogram to the right shows the number of...Ch. R.4 - Prob. 35ESCh. R.4 - The histogram to the right shows the number of...Ch. R.4 - Prob. 37ESCh. R.4 - The histogram to the right shows the number of...Ch. R.4 - The histogram to the right shows the number of...Ch. R.4 - The histogram to the right shows the number of...Ch. R.4 - The histogram to the right shows the number of...Ch. R.4 - The histogram to the right shows the number of...Ch. R.4 - Prob. 43ESCh. R.4 - The following histogram shows the ages of...Ch. R.4 - The following histogram shows the ages of...Ch. R.4 - The following histogram shows the ages of...Ch. R.4 - The following histogram shows the ages of...Ch. R.4 - The following histogram shows the ages of...Ch. R.4 - Prob. 49ESCh. R.4 - The following histogram shows the ages of...Ch. R.4 - The following list shows the golf scores for an...Ch. R.4 - The following list shows the golf scores for an...Ch. R.4 - Prob. 53ESCh. R.4 - Prob. 54ESCh. R.4 - Twenty-five people in a survey were asked to give...Ch. R.4 - Prob. 56ESCh. R.4 - Prob. 57ESCh. R.4 - Prob. 58ESCh. R.4 - Prob. 59ESCh. R.4 - Prob. 60ESCh. R.4 - Use the frequency distribution table from...Ch. R.4 - Use the frequency distribution table from...Ch. R.4 - Prob. 63ESCh. R.4 - Beach Soccer World Cup is now held every two...Ch. R.4 - Prob. 65ESCh. R.4 - Beach Soccer World Cup is now held every two...Ch. R.4 - Beach Soccer World Cup is now held every two...Ch. R.4 - Prob. 68ESCh. R.4 - Prob. 69ESCh. R.4 - Beach Soccer World Cup is now held every two...Ch. R.4 - The following circle graph is a result of...Ch. R.4 - The following circle graph is a result of...Ch. R.4 - Prob. 73ESCh. R.4 - The following circle graph is a result of...Ch. R.4 - Prob. 75ESCh. R.4 - The following circle graph is a result of...Ch. R.4 - The following circle graph shows the percent of...Ch. R.4 - The following circle graph shows the percent of...Ch. R.4 - Prob. 79ESCh. R.4 - The following circle graph shows the percent of...Ch. R.4 - Prob. 81ESCh. R.4 - The total amount of land from the continents is...Ch. R.4 - Prob. 83ESCh. R.4 - The total amount of land from the continents is...Ch. R.4 - Prob. 85ESCh. R.4 - The following circle graph shows the percent of...Ch. R.4 - The following circle graph shows the percent of...Ch. R.4 - The following circle graph shows the percent of...Ch. R.4 - Prob. 89ESCh. R.4 - If this has 125,600 books, find how many books are...Ch. R.4 - Prob. 91ESCh. R.4 - If this has 125,600 books, find how many books are...Ch. R.4 - Prob. 93ESCh. R.4 - If this has 125,600 books, find how many books are...Ch. R.4 - Concept Extensions The following double line graph...Ch. R.4 - Prob. 96ESCh. R.4 - Prob. 97ESCh. R.4 - Concept Extensions The following double line graph...Ch. R.4 - Concept Extensions The following double line graph...Ch. R.4 - Concept Extensions The following double line graph...Ch. R.4 - Concept Extensions The following double line graph...Ch. R.4 - Concept Extensions The following double line graph...Ch. R.4 - Prob. 103ESCh. R.4 - The following circle graph shows the relative...Ch. R.4 - Prob. 105ESCh. R.4 - These oceans together make up 264,489,800 square...Ch. R.4 - Prob. 107ESCh. R.4 - These oceans together make up 264,489,800 square...Ch. R.4 - The following circle graph summarizes the results...Ch. R.4 - The following circle graph summarizes the results...Ch. R.4 - The following circle graph summarizes the results...Ch. R.4 - The following circle graph summarizes the results...Ch. R.4 - The following circle graph summarizes the results...Ch. R.4 - The following circle graph summarizes the results...Ch. R.4 - See the Concept Checks in this section. Can the...Ch. R.4 - True or false? The smaller a sector in a circle...Ch. R - Chapter R Vocabulary Check Fill in each blank with...Ch. R - Prob. 2VCCh. R - Chapter R Vocabulary Check Fill in each blank with...Ch. R - Prob. 4VCCh. R - Prob. 5VCCh. R - Prob. 6VCCh. R - Prob. 7VCCh. R - Prob. 8VCCh. R - Prob. 9VCCh. R - Prob. 10VCCh. R - Chapter R Vocabulary Check Fill in each blank with...Ch. R - Chapter R Vocabulary Check Fill in each blank with...Ch. R - Prob. 13VCCh. R - Prob. 14VCCh. R - Prob. 15VCCh. R - Prob. 16VCCh. R - Prob. 1RCh. R - (R.1) Write the number as product of prime...Ch. R - Prob. 3RCh. R - Perform the indicated operations. Write results in...Ch. R - Prob. 5RCh. R - Perform the indicated operations. Write results in...Ch. R - Perform the indicated operations. Write results in...Ch. R - Perform the indicated operations. Write results in...Ch. R - Perform the indicated operations. Write results in...Ch. R - Perform the indicated operations. Write results in...Ch. R - Each circle represents a whole, or 1. Determine...Ch. R - Each circle represents a whole, or 1. Determine...Ch. R - Find the area and the perimeter of each figure.Ch. R - Find the area and the perimeter of each figure.Ch. R - What was the total weigh of the boy octuplets?Ch. R - What was the total weight of the girl octuplets?Ch. R - Prob. 17RCh. R - Which baby weighed the most?Ch. R - Prob. 19RCh. R - How much more did the heaviest baby weigh than the...Ch. R - Prob. 21RCh. R - Write each decimal as a fraction. Do not simplify....Ch. R - Prob. 23RCh. R - Prob. 24RCh. R - Perform each indicated operation. 184.62Ch. R - Prob. 26RCh. R - Prob. 27RCh. R - Prob. 28RCh. R - Prob. 29RCh. R - Perform each indicated operation. 0.0613.8Ch. R - Prob. 31RCh. R - Round each decimal to given place value. 25.6293,...Ch. R - Prob. 33RCh. R - Prob. 34RCh. R - Write each fraction as a decimal. If the decimal...Ch. R - Write each fraction as a decimal. If the decimal...Ch. R - (R.3) Solve. In a survey of 100 adults, 37...Ch. R - Prob. 38RCh. R - Write each percent as a decimal. 26Ch. R - Write each percent as a decimal. 75Ch. R - Prob. 41RCh. R - Write each percent as a decimal. 1.5Ch. R - Prob. 43RCh. R - Write each percent as a decimal. 400Ch. R - Prob. 45RCh. R - Write each percent as a decimal. 85.34Ch. R - Prob. 47RCh. R - Write each decimal as a percent. 0.055Ch. R - Prob. 49RCh. R - Prob. 50RCh. R - Prob. 51RCh. R - Prob. 52RCh. R - Prob. 53RCh. R - Prob. 54RCh. R - Prob. 55RCh. R - Prob. 56RCh. R - Prob. 57RCh. R - Write each percent as a fraction or mixed number...Ch. R - Prob. 59RCh. R - Write each percent as a fraction or mixed number...Ch. R - Prob. 61RCh. R - Prob. 62RCh. R - Prob. 63RCh. R - Write each fraction or mixed number as percent....Ch. R - Prob. 65RCh. R - Write each fraction or mixed number as percent....Ch. R - Prob. 67RCh. R - Prob. 68RCh. R - Write each fraction or mixed number as percent....Ch. R - Write each fraction or mixed number as percent. 58Ch. R - (R.4) The following pictograph shows the number of...Ch. R - (R.4) The following pictograph shows the number of...Ch. R - Prob. 73RCh. R - Prob. 74RCh. R - Prob. 75RCh. R - Prob. 76RCh. R - The following bar graph shows the percent of...Ch. R - The following bar graph shows the percent of...Ch. R - The following bar graph shows the percent of...Ch. R - The following bar graph shows the percent of...Ch. R - Prob. 81RCh. R - The following line graph shows the total number of...Ch. R - Prob. 83RCh. R - The following line graph shows the total number of...Ch. R - The following line graph shows the total number of...Ch. R - The following line graph shows the total number of...Ch. R - Prob. 87RCh. R - Prob. 88RCh. R - Prob. 89RCh. R - The following histogram shows the hours worked per...Ch. R - Prob. 91RCh. R - Following is a list of monthly record high...Ch. R - Following is a list of monthly record high...Ch. R - Use the table from Exercises 91-93 to draw a...Ch. R - Prob. 95RCh. R - The following circle graph shows a familys $4000...Ch. R - Prob. 97RCh. R - The following circle graph shows a familys $4000...Ch. R - The following circle graph shows a familys $4000...Ch. R - The following circle graph shows a familys $4000...Ch. R - Prob. 101RCh. R - In a recent year, there were approximately 62...Ch. R - Prob. 103RCh. R - In a recent year, there were approximately 62...Ch. R - Prob. 1TCh. R - Prob. 2TCh. R - Prob. 3TCh. R - Prob. 4TCh. R - Perform each indicated operation and simplify....Ch. R - Prob. 6TCh. R - Prob. 7TCh. R - Prob. 8TCh. R - Prob. 9TCh. R - Prob. 10TCh. R - Prob. 11TCh. R - Prob. 12TCh. R - Prob. 13TCh. R - Prob. 14TCh. R - Prob. 15TCh. R - Prob. 16TCh. R - Prob. 17TCh. R - Prob. 18TCh. R - Prob. 19TCh. R - Prob. 20TCh. R - Prob. 21TCh. R - Prob. 22TCh. R - Prob. 23TCh. R - Prob. 24TCh. R - Prob. 25TCh. R - Prob. 26TCh. R - Prob. 27TCh. R - Prob. 28TCh. R - Prob. 29TCh. R - Prob. 30TCh. R - Prob. 31TCh. R - Prob. 32TCh. R - Prob. 33TCh. R - Prob. 34TCh. R - Prob. 35TCh. R - Prob. 36TCh. R - Prob. 37TCh. R - Prob. 38TCh. R - Prob. 39TCh. R - Prob. 40T
Knowledge Booster


Learn more about
Need a deep-dive on the concept behind this application? Look no further. Learn more about this topic, subject and related others by exploring similar questions and additional content below.Similar questions
- hello can you answer 20arrow_forwardGiven this table, what is the relative frequency (expressed as a percent) for red candy found in a bag. Color Number of candies Brown 20 Yellow Green 17 Red 8. 80% 18% 8% 16%arrow_forward3. science fiction 12% Answer: Categories of Books Sold romance 47.4 % mystery 13 % Answer: sports 12% 21-B Book Street Books sells about 1290 books each month. The circle graph displays the most popular book categories, by percentage, each month. computer 15.6 % Step 1. Find the number of romance books sold each month. Round your answer to the nearest integer. Step 2. Find the number of science fiction books sold each month. Round your answer to the nearest integer.arrow_forward
- There is a percentage of canadians who have been voting for Canadian elections every 4 yrs since 1800,george wants to compare the percentage of people who have voted in 1848 to the percentage of people who have voted in 2000.which type of graph should he use 1 bar graph 2 pie chart 3 histogram 4 line chartarrow_forwardDetermine whether the data are qualitative or quantitative. the colors of automobiles on a used car lot O qualitative quantitativearrow_forwardGiven the data set 2,8,10,85,12,7,5,3,10,3,9,4,9, find the 3rd decile.arrow_forward
- Which statement(s) are accurate in their description of frequency and two-way tables? Select all that apply. a Relative frequency must be expressed as a percent. b The ratio that describes how many times a specific event occurs divided by the total number of events is called the data ratio. c Frequency is the amount of times that a specific event has occurred. d A two-way table is a way to describe frequencies for two variables. The rows and columns in the table must display the same categories.arrow_forwardplease use the information on the first page to answer number 17arrow_forwardFor 365 days, an environmental scientist collected the highest temperature in Florida (in Fahrenheit) per day. What is the most appropriate graph to use to display this data? bar graph pie graph histogram scatterplotarrow_forward
- If you wanted to compare the amount of fossil fuels, solar power, and wind energy used in the United States and Germany which type of visual aid would be most effective? A line graph A bar graph A chart A drawing A pie grapharrow_forwardStudents at a high school were polled to determine the type of music they preferred. There were students who completed the poll. Their responses are represented in the circle graph.What percent of students preferred music? Rap 926 alternative 479 rock and rook 274 country 170 jazz 24 other 87 About % of the students who completed the poll preferred alternative music.arrow_forwardSorry i forgot to add the pic here me need helparrow_forward
arrow_back_ios
SEE MORE QUESTIONS
arrow_forward_ios
Recommended textbooks for you
 Holt Mcdougal Larson Pre-algebra: Student Edition...AlgebraISBN:9780547587776Author:HOLT MCDOUGALPublisher:HOLT MCDOUGAL
 Glencoe Algebra 1, Student Edition, 9780079039897...AlgebraISBN:9780079039897Author:CarterPublisher:McGraw Hill
 Big Ideas Math A Bridge To Success Algebra 1: Stu...AlgebraISBN:9781680331141Author:HOUGHTON MIFFLIN HARCOURTPublisher:Houghton Mifflin Harcourt
 Algebra: Structure And Method, Book 1AlgebraISBN:9780395977224Author:Richard G. Brown, Mary P. Dolciani, Robert H. Sorgenfrey, William L. ColePublisher:McDougal Littell
Holt Mcdougal Larson Pre-algebra: Student Edition...
Algebra
ISBN:9780547587776
Author:HOLT MCDOUGAL
Publisher:HOLT MCDOUGAL
Glencoe Algebra 1, Student Edition, 9780079039897...
Algebra
ISBN:9780079039897
Author:Carter
Publisher:McGraw Hill
Big Ideas Math A Bridge To Success Algebra 1: Stu...
Algebra
ISBN:9781680331141
Author:HOUGHTON MIFFLIN HARCOURT
Publisher:Houghton Mifflin Harcourt
Algebra: Structure And Method, Book 1
Algebra
ISBN:9780395977224
Author:Richard G. Brown, Mary P. Dolciani, Robert H. Sorgenfrey, William L. Cole
Publisher:McDougal Littell
Which is the best chart: Selecting among 14 types of charts Part II; Author: 365 Data Science;https://www.youtube.com/watch?v=qGaIB-bRn-A;License: Standard YouTube License, CC-BY