
Key Concept Activity Lab Workbook For Path To College Mathematics
1st Edition
ISBN: 9780134618548
Author: Elayn Martin-Gay
Publisher: PEARSON
expand_more
expand_more
format_list_bulleted
Videos
Textbook Question
Chapter R.4, Problem 99ES
Concept Extensions
The following double line graph shows temperature highs and lows for a week. use this graph to answer Exercises 95 through 100.
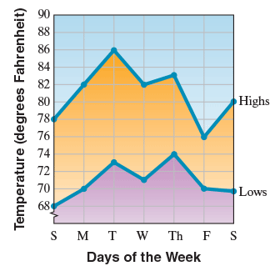
On what day of the week was the difference between the high temperature and the low temperature the greatest? What was this difference in temperature?
Expert Solution & Answer
Want to see the full answer?
Check out a sample textbook solution
Students have asked these similar questions
The double bar graph shown below represents the number of vegetables harvested in July and August by one familly. For which
vegetable was the number harvested in July closest to the number harvested in August?
Number of Vegetables Harvested
O Carrots
O Com
O Peppers
O Potatoes
O Cucumbers
40
35
30
25
20
15
10
Carrots
Corn
Peppers
Potatoes
Cucumbers
July
August
The question is in the image.
Direction: Determine the diagram which would best present the data in the situation below. Then draw the diagram in the space provided to present the data. Make sure to add a title and a legend in the diagram.
Situation:
According to literacy reports in the city of Gotham, youth literacy went up to 7% since 2012. Here is the data:
In 2010, only 43% of the youth population was literate. In the next census at 2015, it went up by 2%. After five years, the literacy rate was at 47%. During the most recent survey on 2020, the rate is already at 50%.
Chapter R Solutions
Key Concept Activity Lab Workbook For Path To College Mathematics
Ch. R.1 - Represent the shaded part of each geometric figure...Ch. R.1 - Represent the shaded part of each geometric figure...Ch. R.1 - Prob. 3ESCh. R.1 - Represent the shaded part of each geometric figure...Ch. R.1 - Prob. 5ESCh. R.1 - Write each number as product of primes. See...Ch. R.1 - Prob. 7ESCh. R.1 - Write each number as product of primes. See...Ch. R.1 - Write each number as product of primes. See...Ch. R.1 - Prob. 10ES
Ch. R.1 - Prob. 11ESCh. R.1 - Prob. 12ESCh. R.1 - Prob. 13ESCh. R.1 - Prob. 14ESCh. R.1 - Prob. 15ESCh. R.1 - Prob. 16ESCh. R.1 - Prob. 17ESCh. R.1 - Prob. 18ESCh. R.1 - Prob. 19ESCh. R.1 - Prob. 20ESCh. R.1 - Prob. 21ESCh. R.1 - Prob. 22ESCh. R.1 - Prob. 23ESCh. R.1 - Prob. 24ESCh. R.1 - Prob. 25ESCh. R.1 - Prob. 26ESCh. R.1 - Prob. 27ESCh. R.1 - Multiply or divided as indicated. Simplify the...Ch. R.1 - Multiply or divided as indicated. Simplify the...Ch. R.1 - Prob. 30ESCh. R.1 - Prob. 31ESCh. R.1 - Prob. 32ESCh. R.1 - Prob. 33ESCh. R.1 - Prob. 34ESCh. R.1 - Prob. 35ESCh. R.1 - Prob. 36ESCh. R.1 - Prob. 37ESCh. R.1 - Prob. 38ESCh. R.1 - Recall that the area of a plane figure is a...Ch. R.1 - Prob. 40ESCh. R.1 - Prob. 41ESCh. R.1 - Prob. 42ESCh. R.1 - Prob. 43ESCh. R.1 - Add or subtract as indicated. Write the answer in...Ch. R.1 - Prob. 45ESCh. R.1 - Prob. 46ESCh. R.1 - Prob. 47ESCh. R.1 - Prob. 48ESCh. R.1 - Prob. 49ESCh. R.1 - Prob. 50ESCh. R.1 - Prob. 51ESCh. R.1 - Prob. 52ESCh. R.1 - Prob. 53ESCh. R.1 - Prob. 54ESCh. R.1 - Prob. 55ESCh. R.1 - Prob. 56ESCh. R.1 - Prob. 57ESCh. R.1 - Prob. 58ESCh. R.1 - Prob. 59ESCh. R.1 - Prob. 60ESCh. R.1 - Prob. 61ESCh. R.1 - Prob. 62ESCh. R.1 - Prob. 63ESCh. R.1 - Prob. 64ESCh. R.1 - Prob. 65ESCh. R.1 - Prob. 66ESCh. R.1 - Prob. 67ESCh. R.1 - Prob. 68ESCh. R.1 - Prob. 69ESCh. R.1 - Prob. 70ESCh. R.1 - Prob. 71ESCh. R.1 - Prob. 72ESCh. R.1 - Prob. 73ESCh. R.1 - Prob. 74ESCh. R.1 - Prob. 75ESCh. R.1 - Prob. 76ESCh. R.1 - Prob. 77ESCh. R.1 - Mixed Practice Perform the following operations....Ch. R.1 - Prob. 79ESCh. R.1 - Prob. 80ESCh. R.1 - Mixed Practice Perform the following operations....Ch. R.1 - Prob. 82ESCh. R.1 - Prob. 83ESCh. R.1 - Prob. 84ESCh. R.1 - Prob. 85ESCh. R.1 - Mixed Practice Perform the following operations....Ch. R.1 - Prob. 87ESCh. R.1 - Prob. 88ESCh. R.1 - Mixed Practice 121433 Perform the following...Ch. R.1 - Prob. 90ESCh. R.1 - Prob. 91ESCh. R.1 - Prob. 92ESCh. R.1 - Prob. 93ESCh. R.1 - Prob. 94ESCh. R.1 - Prob. 95ESCh. R.1 - Prob. 96ESCh. R.1 - Prob. 97ESCh. R.1 - Prob. 98ESCh. R.1 - Prob. 99ESCh. R.1 - Prob. 100ESCh. R.1 - Prob. 101ESCh. R.1 - Prob. 102ESCh. R.1 - Prob. 103ESCh. R.1 - Prob. 104ESCh. R.1 - Prob. 105ESCh. R.1 - Prob. 106ESCh. R.1 - Prob. 107ESCh. R.1 - Prob. 108ESCh. R.1 - Prob. 109ESCh. R.1 - Prob. 110ESCh. R.2 - Write each decimal as a fraction. Do not simplify....Ch. R.2 - Prob. 2ESCh. R.2 - Prob. 3ESCh. R.2 - Prob. 4ESCh. R.2 - Prob. 5ESCh. R.2 - Prob. 6ESCh. R.2 - Prob. 7ESCh. R.2 - Prob. 8ESCh. R.2 - Prob. 9ESCh. R.2 - Prob. 10ESCh. R.2 - Prob. 11ESCh. R.2 - Prob. 12ESCh. R.2 - Prob. 13ESCh. R.2 - Prob. 14ESCh. R.2 - Prob. 15ESCh. R.2 - Prob. 16ESCh. R.2 - Prob. 17ESCh. R.2 - Prob. 18ESCh. R.2 - Prob. 19ESCh. R.2 - Prob. 20ESCh. R.2 - Prob. 21ESCh. R.2 - Prob. 22ESCh. R.2 - Multiply or divide as indicated. See Example 6 and...Ch. R.2 - Multiply or divide as indicated. See Example 6 and...Ch. R.2 - Mixed Practice Perform the indicated operation....Ch. R.2 - Mixed Practice Perform the indicated operation....Ch. R.2 - Mixed Practice Perform the indicated operation....Ch. R.2 - Mixed Practice Perform the indicated operation....Ch. R.2 - Mixed Practice Perform the indicated operation....Ch. R.2 - Mixed Practice Perform the indicated operation....Ch. R.2 - Mixed Practice 654.956.67 Perform the indicated...Ch. R.2 - Mixed Practice Perform the indicated operation....Ch. R.2 - Mixed Practice Perform the indicated operation....Ch. R.2 - Mixed Practice Perform the indicated operation....Ch. R.2 - Prob. 35ESCh. R.2 - Prob. 36ESCh. R.2 - Mixed Practice Perform the indicated operation....Ch. R.2 - Mixed Practice Perform the indicated operation....Ch. R.2 - Round each decimal to the given place value. See...Ch. R.2 - Round each decimal to the given place value. See...Ch. R.2 - Round each decimal to the given place value. See...Ch. R.2 - Round each decimal to the given place value. See...Ch. R.2 - Round each decimal to the given place value. See...Ch. R.2 - Round each decimal to the given place value. See...Ch. R.2 - Round each decimal to the given place value. See...Ch. R.2 - Round each decimal to the given place value. See...Ch. R.2 - Round each decimal to the given place value. See...Ch. R.2 - Round each decimal to the given place value. See...Ch. R.2 - Write each fraction as a decimal. If the decimal...Ch. R.2 - Write each fraction as a decimal. If the decimal...Ch. R.2 - Write each fraction as a decimal. If the decimal...Ch. R.2 - Write each fraction as a decimal. If the decimal...Ch. R.2 - Write each fraction as a decimal. If the decimal...Ch. R.2 - Write each fraction as a decimal. If the decimal...Ch. R.2 - Write each fraction as a decimal. If the decimal...Ch. R.2 - Write each fraction as a decimal. If the decimal...Ch. R.2 - Write each fraction as a decimal. If the decimal...Ch. R.2 - Write each fraction as a decimal. If the decimal...Ch. R.2 - Concept Extensions Solve. See the Concept Checks...Ch. R.2 - Concept Extensions Solve. See the Concept Checks...Ch. R.2 - Concept Extensions Solve. See the Concept Checks...Ch. R.2 - Concept Extensions Solve. See the Concept Checks...Ch. R.2 - The chart shows the average number of pounds of...Ch. R.2 - The chart shows the average number of pounds of...Ch. R.2 - The following graph is called a circle graph or...Ch. R.2 - The following graph is called a circle graph or...Ch. R.2 - The following graph is called a circle graph or...Ch. R.2 - The following graph is called a circle graph or...Ch. R.2 - The following graph is called a circle graph or...Ch. R.2 - The following graph is called a circle graph or...Ch. R.3 - Solve. See Example 1 and 2. In a survey of 100...Ch. R.3 - Solve. See Example 1 and 2. A basketball player...Ch. R.3 - One hundred adults were asked to name their...Ch. R.3 - One hundred adults were asked to name their...Ch. R.3 - One hundred adults were asked to name their...Ch. R.3 - One hundred adults were asked to name their...Ch. R.3 - Write each percent as a decimal. See Examples 3...Ch. R.3 - Write each percent as a decimal. See Examples 3...Ch. R.3 - Write each percent as a decimal. See Examples 3...Ch. R.3 - Write each percent as a decimal. See Examples 3...Ch. R.3 - Write each percent as a decimal. See Examples 3...Ch. R.3 - Write each percent as a decimal. See Examples 3...Ch. R.3 - Write each percent as a decimal. See Examples 3...Ch. R.3 - Write each percent as a decimal. See Examples 3...Ch. R.3 - Write each percent as a decimal. See Examples 3...Ch. R.3 - Write each percent as a decimal. See Examples 3...Ch. R.3 - Write each percent as a decimal. See Examples 3...Ch. R.3 - Write each percent as a decimal. See Examples 3...Ch. R.3 - Write each percent as a decimal. See Examples 3...Ch. R.3 - Write each percent as a decimal. See Examples 3...Ch. R.3 - Write each percent as a decimal. See Examples 3...Ch. R.3 - Write each percent as a decimal. See Examples 3...Ch. R.3 - Write each percent as a fraction or mixed number...Ch. R.3 - Write each percent as a fraction or mixed number...Ch. R.3 - Write each percent as a fraction or mixed number...Ch. R.3 - Write each percent as a fraction or mixed number...Ch. R.3 - Write each percent as a fraction or mixed number...Ch. R.3 - Write each percent as a fraction or mixed number...Ch. R.3 - Write each percent as a fraction or mixed number...Ch. R.3 - Write each percent as a fraction or mixed number...Ch. R.3 - Write each percent as a fraction or mixed number...Ch. R.3 - Write each percent as a fraction or mixed number...Ch. R.3 - Write each percent as a fraction or mixed number...Ch. R.3 - Write each percent as a fraction or mixed number...Ch. R.3 - Write each percent as a fraction or mixed number...Ch. R.3 - Write each percent as a fraction or mixed number...Ch. R.3 - Write each decimal as a percent. See Examples 13...Ch. R.3 - Write each decimal as a percent. See Examples 13...Ch. R.3 - Write each decimal as a percent. See Examples 13...Ch. R.3 - Write each decimal as a percent. See Examples 13...Ch. R.3 - Write each decimal as a percent. See Examples 13...Ch. R.3 - Write each decimal as a percent. See Examples 13...Ch. R.3 - Write each decimal as a percent. See Examples 13...Ch. R.3 - Write each decimal as a percent. See Examples 13...Ch. R.3 - Write each decimal as a percent. See Examples 13...Ch. R.3 - Write each decimal as a percent. See Examples 13...Ch. R.3 - Prob. 47ESCh. R.3 - Write each decimal as a percent. See Examples 13...Ch. R.3 - Write each decimal as a percent. See Examples 13...Ch. R.3 - Write each decimal as a percent. See Examples 13...Ch. R.3 - Write each fraction or mixed number as a percent....Ch. R.3 - Write each fraction or mixed number as a percent....Ch. R.3 - Write each fraction or mixed number as a percent....Ch. R.3 - Write each fraction or mixed number as a percent....Ch. R.3 - Write each fraction or mixed number as a percent....Ch. R.3 - Write each fraction or mixed number as a percent....Ch. R.3 - Write each fraction or mixed number as a percent....Ch. R.3 - Write each fraction or mixed number as a percent....Ch. R.3 - Write each fraction or mixed number as a percent....Ch. R.3 - Write each fraction or mixed number as a percent....Ch. R.3 - Write each fraction or mixed number as a percent....Ch. R.3 - Write each fraction or mixed number as a percent....Ch. R.3 - Write each fraction or mixed number as a percent....Ch. R.3 - Write each fraction or mixed number as a percent....Ch. R.3 - Write each fraction as a percent. Round to the...Ch. R.3 - Write each fraction as a percent. Round to the...Ch. R.3 - Write each fraction as a percent. Round to the...Ch. R.3 - Write each fraction as a percent. Round to the...Ch. R.3 - Mixed Practice Complete each table. See Example 1...Ch. R.3 - Mixed Practice Complete each table. See Example 1...Ch. R.3 - Mixed Practice Complete each table. See Example 1...Ch. R.3 - Mixed Practice Complete each table. See Example 1...Ch. R.3 - Write each percent as a decimal and a fraction....Ch. R.3 - Write each percent as a decimal and a fraction....Ch. R.3 - Write each percent as a decimal and a fraction....Ch. R.3 - Write each percent as a decimal and a fraction....Ch. R.3 - Write each percent as a decimal and a fraction....Ch. R.3 - Write each percent as a decimal and a fraction....Ch. R.3 - In Exercises 79 through 82, write the percent from...Ch. R.3 - In Exercises 79 through 82, write the percent from...Ch. R.3 - In Exercises 79 through 82, write the percent from...Ch. R.3 - In Exercises 79 through 82, write the percent from...Ch. R.3 - Solve. See Examples 21 and 22. In a particular...Ch. R.3 - Solve. See Examples 21 and 22. The United States'...Ch. R.3 - Solve. See Examples 21 and 22. The mirrors on the...Ch. R.3 - Solve. See Examples 21 and 22. In a particular...Ch. R.3 - Solve. See Examples 21 and 22. The U.S. Postal...Ch. R.3 - Solve. See Examples 21 and 22. In the United...Ch. R.3 - Concept Extensions Solve. See the Concept Checks...Ch. R.3 - Concept Extensions 0.5269, Solve. See the Concept...Ch. R.3 - Concept Extensions Solve. See the Concept Checks...Ch. R.3 - Concept Extensions Solve. See the Concept Checks...Ch. R.3 - Recall that 1=100 This means that 1 whole is 100....Ch. R.3 - Recall that 1=100 This means that 1 whole is 100....Ch. R.3 - What percent of the figure is shaded?Ch. R.3 - What percent of the figure is shaded?Ch. R.3 - Fill in the blanks. A fraction written as a...Ch. R.3 - Fill in the blanks. A decimal written as a percent...Ch. R.3 - Write each fraction as a decimal and then Mite...Ch. R.3 - Write each fraction as a decimal and then Mite...Ch. R.3 - The bar graph shows the predicted fastest-growing...Ch. R.3 - The bar graph shows the predicted fastest-growing...Ch. R.3 - The bar graph shows the predicted fastest-growing...Ch. R.3 - The bar graph shows the predicted fastest-growing...Ch. R.3 - The bar graph shows the predicted fastest-growing...Ch. R.3 - The bar graph shows the predicted fastest-growing...Ch. R.4 - The following pictograph shows the number of acres...Ch. R.4 - The following pictograph shows the number of acres...Ch. R.4 - The following pictograph shows the number of acres...Ch. R.4 - The following pictograph shows the number of acres...Ch. R.4 - Prob. 5ESCh. R.4 - The following pictograph shows the number of acres...Ch. R.4 - The following pictograph shows the number of acres...Ch. R.4 - The following pictograph shows the number of acres...Ch. R.4 - The following pictograph shows the average number...Ch. R.4 - The following pictograph shows the average number...Ch. R.4 - The following pictograph shows the average number...Ch. R.4 - The following pictograph shows the average number...Ch. R.4 - The following pictograph shows the average number...Ch. R.4 - The following pictograph shows the average number...Ch. R.4 - The following pictograph shows the average number...Ch. R.4 - The following pictograph shows the average number...Ch. R.4 - The National Weather Service has exacting...Ch. R.4 - The National Weather Service has exacting...Ch. R.4 - The National Weather Service has exacting...Ch. R.4 - The National Weather Service has exacting...Ch. R.4 - The National Weather Service has exacting...Ch. R.4 - The National Weather Service has exacting...Ch. R.4 - The following horizontal bar graph shows a recent...Ch. R.4 - The following horizontal bar graph shows a recent...Ch. R.4 - The following horizontal bar graph shows a recent...Ch. R.4 - The following horizontal bar graph shows a recent...Ch. R.4 - The following horizontal bar graph shows a recent...Ch. R.4 - The following horizontal bar graph shows a recent...Ch. R.4 - Use the information given to draw a vertical bar...Ch. R.4 - Use the information given to draw a vertical bar...Ch. R.4 - Prob. 31ESCh. R.4 - Prob. 32ESCh. R.4 - The histogram to the right shows the number of...Ch. R.4 - The histogram to the right shows the number of...Ch. R.4 - Prob. 35ESCh. R.4 - The histogram to the right shows the number of...Ch. R.4 - Prob. 37ESCh. R.4 - The histogram to the right shows the number of...Ch. R.4 - The histogram to the right shows the number of...Ch. R.4 - The histogram to the right shows the number of...Ch. R.4 - The histogram to the right shows the number of...Ch. R.4 - The histogram to the right shows the number of...Ch. R.4 - Prob. 43ESCh. R.4 - The following histogram shows the ages of...Ch. R.4 - The following histogram shows the ages of...Ch. R.4 - The following histogram shows the ages of...Ch. R.4 - The following histogram shows the ages of...Ch. R.4 - The following histogram shows the ages of...Ch. R.4 - Prob. 49ESCh. R.4 - The following histogram shows the ages of...Ch. R.4 - The following list shows the golf scores for an...Ch. R.4 - The following list shows the golf scores for an...Ch. R.4 - Prob. 53ESCh. R.4 - Prob. 54ESCh. R.4 - Twenty-five people in a survey were asked to give...Ch. R.4 - Prob. 56ESCh. R.4 - Prob. 57ESCh. R.4 - Prob. 58ESCh. R.4 - Prob. 59ESCh. R.4 - Prob. 60ESCh. R.4 - Use the frequency distribution table from...Ch. R.4 - Use the frequency distribution table from...Ch. R.4 - Prob. 63ESCh. R.4 - Beach Soccer World Cup is now held every two...Ch. R.4 - Prob. 65ESCh. R.4 - Beach Soccer World Cup is now held every two...Ch. R.4 - Beach Soccer World Cup is now held every two...Ch. R.4 - Prob. 68ESCh. R.4 - Prob. 69ESCh. R.4 - Beach Soccer World Cup is now held every two...Ch. R.4 - The following circle graph is a result of...Ch. R.4 - The following circle graph is a result of...Ch. R.4 - Prob. 73ESCh. R.4 - The following circle graph is a result of...Ch. R.4 - Prob. 75ESCh. R.4 - The following circle graph is a result of...Ch. R.4 - The following circle graph shows the percent of...Ch. R.4 - The following circle graph shows the percent of...Ch. R.4 - Prob. 79ESCh. R.4 - The following circle graph shows the percent of...Ch. R.4 - Prob. 81ESCh. R.4 - The total amount of land from the continents is...Ch. R.4 - Prob. 83ESCh. R.4 - The total amount of land from the continents is...Ch. R.4 - Prob. 85ESCh. R.4 - The following circle graph shows the percent of...Ch. R.4 - The following circle graph shows the percent of...Ch. R.4 - The following circle graph shows the percent of...Ch. R.4 - Prob. 89ESCh. R.4 - If this has 125,600 books, find how many books are...Ch. R.4 - Prob. 91ESCh. R.4 - If this has 125,600 books, find how many books are...Ch. R.4 - Prob. 93ESCh. R.4 - If this has 125,600 books, find how many books are...Ch. R.4 - Concept Extensions The following double line graph...Ch. R.4 - Prob. 96ESCh. R.4 - Prob. 97ESCh. R.4 - Concept Extensions The following double line graph...Ch. R.4 - Concept Extensions The following double line graph...Ch. R.4 - Concept Extensions The following double line graph...Ch. R.4 - Concept Extensions The following double line graph...Ch. R.4 - Concept Extensions The following double line graph...Ch. R.4 - Prob. 103ESCh. R.4 - The following circle graph shows the relative...Ch. R.4 - Prob. 105ESCh. R.4 - These oceans together make up 264,489,800 square...Ch. R.4 - Prob. 107ESCh. R.4 - These oceans together make up 264,489,800 square...Ch. R.4 - The following circle graph summarizes the results...Ch. R.4 - The following circle graph summarizes the results...Ch. R.4 - The following circle graph summarizes the results...Ch. R.4 - The following circle graph summarizes the results...Ch. R.4 - The following circle graph summarizes the results...Ch. R.4 - The following circle graph summarizes the results...Ch. R.4 - See the Concept Checks in this section. Can the...Ch. R.4 - True or false? The smaller a sector in a circle...Ch. R - Chapter R Vocabulary Check Fill in each blank with...Ch. R - Prob. 2VCCh. R - Chapter R Vocabulary Check Fill in each blank with...Ch. R - Prob. 4VCCh. R - Prob. 5VCCh. R - Prob. 6VCCh. R - Prob. 7VCCh. R - Prob. 8VCCh. R - Prob. 9VCCh. R - Prob. 10VCCh. R - Chapter R Vocabulary Check Fill in each blank with...Ch. R - Chapter R Vocabulary Check Fill in each blank with...Ch. R - Prob. 13VCCh. R - Prob. 14VCCh. R - Prob. 15VCCh. R - Prob. 16VCCh. R - Prob. 1RCh. R - (R.1) Write the number as product of prime...Ch. R - Prob. 3RCh. R - Perform the indicated operations. Write results in...Ch. R - Prob. 5RCh. R - Perform the indicated operations. Write results in...Ch. R - Perform the indicated operations. Write results in...Ch. R - Perform the indicated operations. Write results in...Ch. R - Perform the indicated operations. Write results in...Ch. R - Perform the indicated operations. Write results in...Ch. R - Each circle represents a whole, or 1. Determine...Ch. R - Each circle represents a whole, or 1. Determine...Ch. R - Find the area and the perimeter of each figure.Ch. R - Find the area and the perimeter of each figure.Ch. R - What was the total weigh of the boy octuplets?Ch. R - What was the total weight of the girl octuplets?Ch. R - Prob. 17RCh. R - Which baby weighed the most?Ch. R - Prob. 19RCh. R - How much more did the heaviest baby weigh than the...Ch. R - Prob. 21RCh. R - Write each decimal as a fraction. Do not simplify....Ch. R - Prob. 23RCh. R - Prob. 24RCh. R - Perform each indicated operation. 184.62Ch. R - Prob. 26RCh. R - Prob. 27RCh. R - Prob. 28RCh. R - Prob. 29RCh. R - Perform each indicated operation. 0.0613.8Ch. R - Prob. 31RCh. R - Round each decimal to given place value. 25.6293,...Ch. R - Prob. 33RCh. R - Prob. 34RCh. R - Write each fraction as a decimal. If the decimal...Ch. R - Write each fraction as a decimal. If the decimal...Ch. R - (R.3) Solve. In a survey of 100 adults, 37...Ch. R - Prob. 38RCh. R - Write each percent as a decimal. 26Ch. R - Write each percent as a decimal. 75Ch. R - Prob. 41RCh. R - Write each percent as a decimal. 1.5Ch. R - Prob. 43RCh. R - Write each percent as a decimal. 400Ch. R - Prob. 45RCh. R - Write each percent as a decimal. 85.34Ch. R - Prob. 47RCh. R - Write each decimal as a percent. 0.055Ch. R - Prob. 49RCh. R - Prob. 50RCh. R - Prob. 51RCh. R - Prob. 52RCh. R - Prob. 53RCh. R - Prob. 54RCh. R - Prob. 55RCh. R - Prob. 56RCh. R - Prob. 57RCh. R - Write each percent as a fraction or mixed number...Ch. R - Prob. 59RCh. R - Write each percent as a fraction or mixed number...Ch. R - Prob. 61RCh. R - Prob. 62RCh. R - Prob. 63RCh. R - Write each fraction or mixed number as percent....Ch. R - Prob. 65RCh. R - Write each fraction or mixed number as percent....Ch. R - Prob. 67RCh. R - Prob. 68RCh. R - Write each fraction or mixed number as percent....Ch. R - Write each fraction or mixed number as percent. 58Ch. R - (R.4) The following pictograph shows the number of...Ch. R - (R.4) The following pictograph shows the number of...Ch. R - Prob. 73RCh. R - Prob. 74RCh. R - Prob. 75RCh. R - Prob. 76RCh. R - The following bar graph shows the percent of...Ch. R - The following bar graph shows the percent of...Ch. R - The following bar graph shows the percent of...Ch. R - The following bar graph shows the percent of...Ch. R - Prob. 81RCh. R - The following line graph shows the total number of...Ch. R - Prob. 83RCh. R - The following line graph shows the total number of...Ch. R - The following line graph shows the total number of...Ch. R - The following line graph shows the total number of...Ch. R - Prob. 87RCh. R - Prob. 88RCh. R - Prob. 89RCh. R - The following histogram shows the hours worked per...Ch. R - Prob. 91RCh. R - Following is a list of monthly record high...Ch. R - Following is a list of monthly record high...Ch. R - Use the table from Exercises 91-93 to draw a...Ch. R - Prob. 95RCh. R - The following circle graph shows a familys $4000...Ch. R - Prob. 97RCh. R - The following circle graph shows a familys $4000...Ch. R - The following circle graph shows a familys $4000...Ch. R - The following circle graph shows a familys $4000...Ch. R - Prob. 101RCh. R - In a recent year, there were approximately 62...Ch. R - Prob. 103RCh. R - In a recent year, there were approximately 62...Ch. R - Prob. 1TCh. R - Prob. 2TCh. R - Prob. 3TCh. R - Prob. 4TCh. R - Perform each indicated operation and simplify....Ch. R - Prob. 6TCh. R - Prob. 7TCh. R - Prob. 8TCh. R - Prob. 9TCh. R - Prob. 10TCh. R - Prob. 11TCh. R - Prob. 12TCh. R - Prob. 13TCh. R - Prob. 14TCh. R - Prob. 15TCh. R - Prob. 16TCh. R - Prob. 17TCh. R - Prob. 18TCh. R - Prob. 19TCh. R - Prob. 20TCh. R - Prob. 21TCh. R - Prob. 22TCh. R - Prob. 23TCh. R - Prob. 24TCh. R - Prob. 25TCh. R - Prob. 26TCh. R - Prob. 27TCh. R - Prob. 28TCh. R - Prob. 29TCh. R - Prob. 30TCh. R - Prob. 31TCh. R - Prob. 32TCh. R - Prob. 33TCh. R - Prob. 34TCh. R - Prob. 35TCh. R - Prob. 36TCh. R - Prob. 37TCh. R - Prob. 38TCh. R - Prob. 39TCh. R - Prob. 40T
Knowledge Booster


Learn more about
Need a deep-dive on the concept behind this application? Look no further. Learn more about this topic, subject and related others by exploring similar questions and additional content below.Similar questions
- The older a child, the taller they are. Identify the relationship between age and height.arrow_forwardThe vertical bar graph to the right shows the total sales by the days of the week for a certain gift shop. What day of the week had the highest amount in sales? What day had the lowest amount in sales? The highest amount of sales was on The lowest amount of sales was on Total sales for day 750- 700- 650- 600- 550- 500- 450- 400- 350- 300- 250- Mon. Tues. Wed. Thurs. Fri. Sat.arrow_forwardPlease solve the questions I have attached the data in the screenshot and the codes that can be used for the questions. Thank you.arrow_forward
- What is the height of this graph? There’s one rectangle missing. This graph represents silver in parts per million.arrow_forwardAndre earns $5200 a month at his new job. In order to track his spending and saving, he created a monthly budget Andre divided his income into five categories and created the following circle graph to represent the budget he created for himself. Use this circle graph to answer the following questions. How much more money does Andre budget for Groceries and Utilities than he does for savings?? SHOW WORK PLEASE.arrow_forwardWhich two points that Ethan plotted represent numbers that have a sum of 0?Show or explain how you got your answer.arrow_forward
- figure:2 iii. The following pie chart shows the destination of the exported Omani crude oil in March 2019. Study the following graph and answer the following question (Total exported quantities of Oman crude oil = 25704226 barrels) a. How many barrels of Omani crude oil exported to Japan? b. If the crude oil barrel price in March 2019 was $66. What is the value of Chinese purchases of crude oil from Oman in that month? Crude Oil Destination March 2019 Republic of the Union of Myanmar 7.76% People's Republic of China Jаpan 5.44% 81.37% LRepublic of India 3.88% United Republic of Tanzania 1.56%arrow_forwardA farmer plants crops on 48 acres of land. The circle graph shows the percentages of land used for some of the different types of crops. Land for Crops Corn Cotton 40% Other 10% Wheat 20% Based on the circle graph, how many acres of land are used for corn? Record your answer and fill in the bubbles on your answer document. Be sure to use the correct place value.arrow_forwardsolve with great details as much as possible pleasearrow_forward
- What is the most common trick to mislead readers of bar graphs? Choose the correct answer below. CLUB O A. Change the color of the bars to make some categories appear more important than others. O B. Change the scale of the horizontal axis so that it does not start at 0. OC. Change the scale of the vertical axis so that it does not start at 0. OD. Change the width of the bars to make some categories appear more important than others. 2arrow_forwardA person 6 feet tall is walking away from a lamp post that is 24 ft tall in the dark. Draw several diagrams to show different lengths of shadows as the person moves away from the lamp post b. Set up a mathematical relationship based on your diagram a.arrow_forwardIan jogs 4 miles to the lake, rests for 30 minutes, and then jogs back. Write a graph showing the comparison of distance to timearrow_forward
arrow_back_ios
SEE MORE QUESTIONS
arrow_forward_ios
Recommended textbooks for you
 Glencoe Algebra 1, Student Edition, 9780079039897...AlgebraISBN:9780079039897Author:CarterPublisher:McGraw Hill
 Holt Mcdougal Larson Pre-algebra: Student Edition...AlgebraISBN:9780547587776Author:HOLT MCDOUGALPublisher:HOLT MCDOUGAL
 College Algebra (MindTap Course List)AlgebraISBN:9781305652231Author:R. David Gustafson, Jeff HughesPublisher:Cengage Learning
 Intermediate AlgebraAlgebraISBN:9781285195728Author:Jerome E. Kaufmann, Karen L. SchwittersPublisher:Cengage Learning
Glencoe Algebra 1, Student Edition, 9780079039897...
Algebra
ISBN:9780079039897
Author:Carter
Publisher:McGraw Hill
Holt Mcdougal Larson Pre-algebra: Student Edition...
Algebra
ISBN:9780547587776
Author:HOLT MCDOUGAL
Publisher:HOLT MCDOUGAL
College Algebra (MindTap Course List)
Algebra
ISBN:9781305652231
Author:R. David Gustafson, Jeff Hughes
Publisher:Cengage Learning
Intermediate Algebra
Algebra
ISBN:9781285195728
Author:Jerome E. Kaufmann, Karen L. Schwitters
Publisher:Cengage Learning
2.1 Introduction to inequalities; Author: Oli Notes;https://www.youtube.com/watch?v=D6erN5YTlXE;License: Standard YouTube License, CC-BY
GCSE Maths - What are Inequalities? (Inequalities Part 1) #56; Author: Cognito;https://www.youtube.com/watch?v=e_tY6X5PwWw;License: Standard YouTube License, CC-BY
Introduction to Inequalities | Inequality Symbols | Testing Solutions for Inequalities; Author: Scam Squad Math;https://www.youtube.com/watch?v=paZSN7sV1R8;License: Standard YouTube License, CC-BY