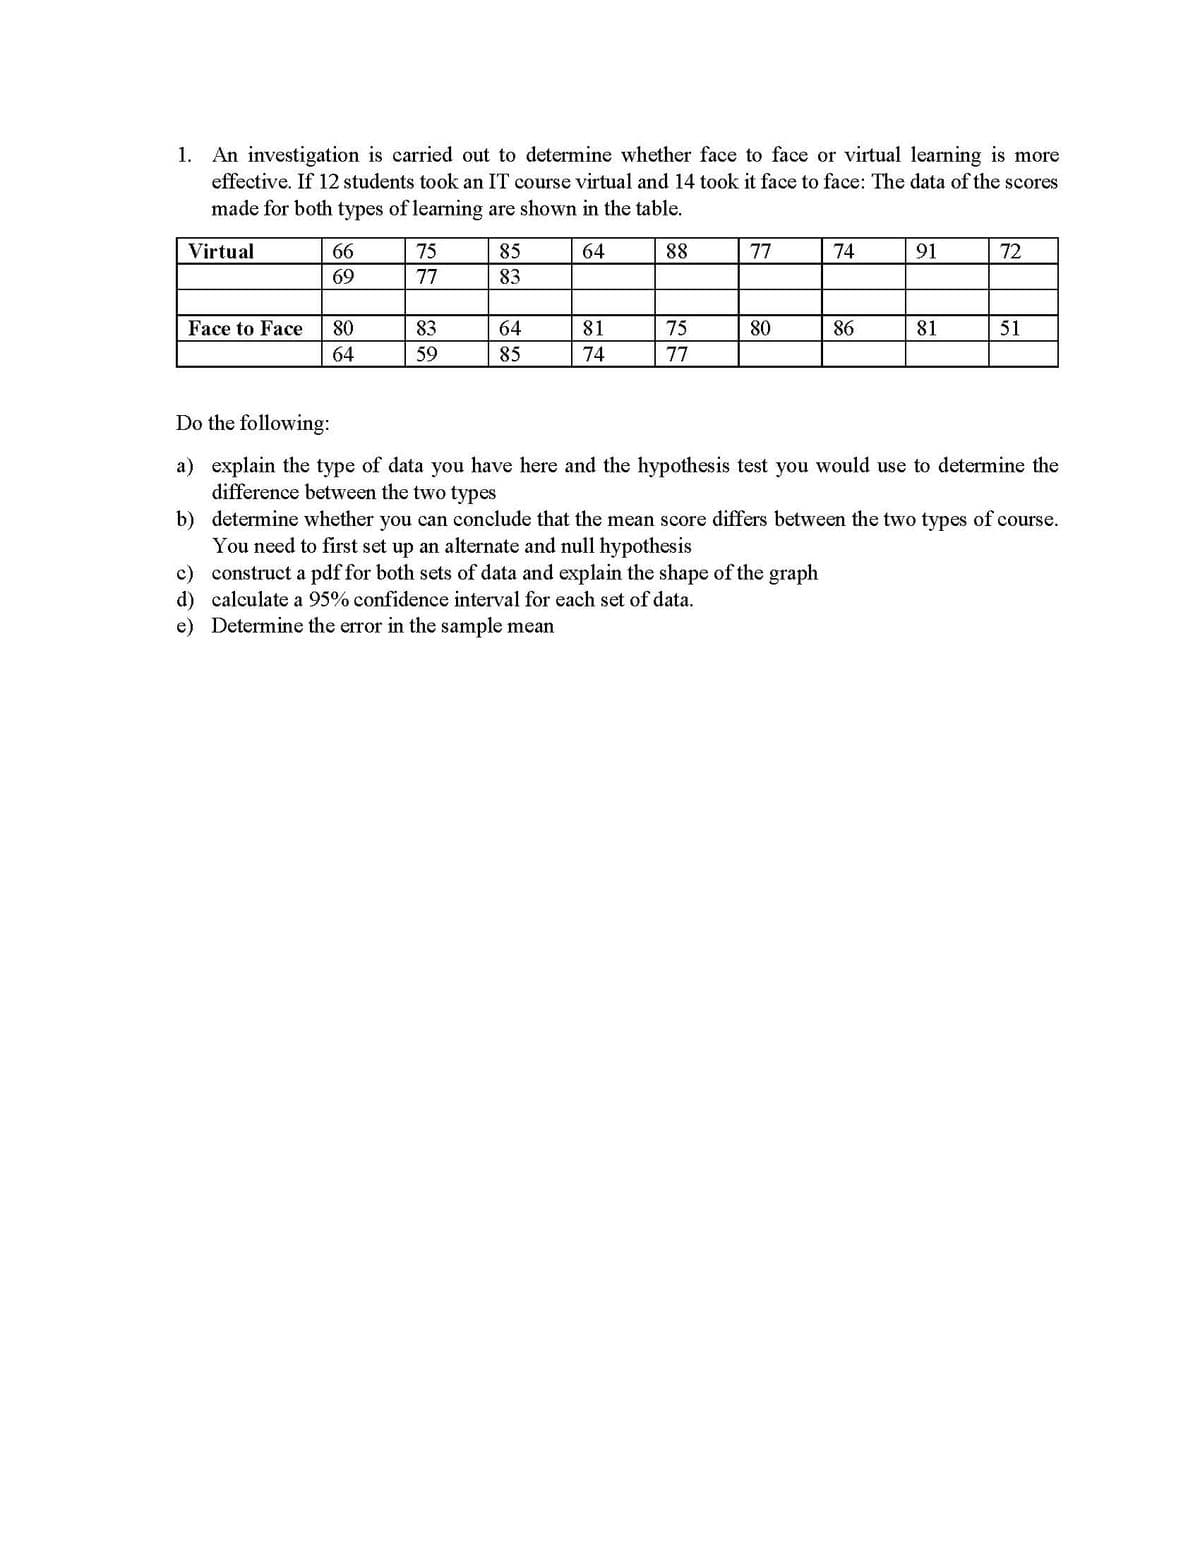
1. An investigation is carried out to determine whether face to face or virtual learning is more effective. If 12 students took an IT course virtual and 14 took it face to face: The data of the scores made for both types of learning are shown in the table. Virtual 66 75 85 64 88 77 74 91 72 69 77 83 Face to Face 80 83 64 81 75 80 86 81 51 64 59 85 74 77 Do the following: a) explain the type of data you have here and the hypothesis test you would use to determine the difference between the two types b) determine whether you can conclude that the mean score differs between the two types of course. You need to first set up an alternate and null hypothesis c) construct a pdf for both sets of data and explain the shape of the graph d) calculate a 95% confidence interval for each set of data. e) Determine the error in the sample mean


Percentage
A percentage is a number indicated as a fraction of 100. It is a dimensionless number often expressed using the symbol %.
Algebraic Expressions
In mathematics, an algebraic expression consists of constant(s), variable(s), and mathematical operators. It is made up of terms.
Numbers
Numbers are some measures used for counting. They can be compared one with another to know its position in the number line and determine which one is greater or lesser than the other.
Subtraction
Before we begin to understand the subtraction of algebraic expressions, we need to list out a few things that form the basis of algebra.
Addition
Before we begin to understand the addition of algebraic expressions, we need to list out a few things that form the basis of algebra.
Do part d

Step by step
Solved in 2 steps with 6 images


