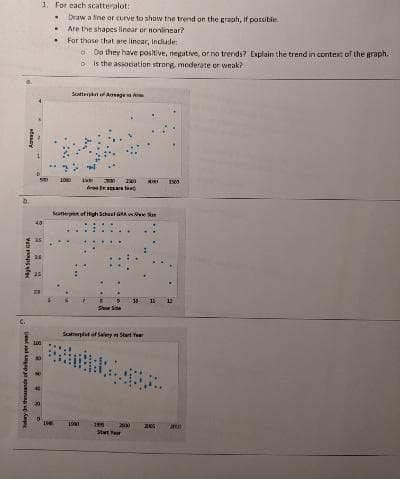
1. For each scatteralot: • Draw a tine or curve to show the trend on the graph, if passible. Are the shapes linear or nonlinear? Far thase that are lincar, Include o Do they have posltive, negative, or no trends? Explain the trend in context of the graph. o Is the association strong, mederate or weak? Soterpat o Aragea A 00 2500 tees n se fe Sotterplot of High Scheel Shoe Sise Scatterplet of Selery Start Year 100 1990 2000 000 Stat Tar olry n thoande of dos per yea VAD papssfe


Quadratic Equation
When it comes to the concept of polynomial equations, quadratic equations can be said to be a special case. What does solving a quadratic equation mean? We will understand the quadratics and their types once we are familiar with the polynomial equations and their types.
Demand and Supply Function
The concept of demand and supply is important for various factors. One of them is studying and evaluating the condition of an economy within a given period of time. The analysis or evaluation of the demand side factors are important for the suppliers to understand the consumer behavior. The evaluation of supply side factors is important for the consumers in order to understand that what kind of combination of goods or what kind of goods and services he or she should consume in order to maximize his utility and minimize the cost. Therefore, in microeconomics both of these concepts are extremely important in order to have an idea that what exactly is going on in the economy.
how do you work a,b, and C? Thanks!
a.
The line is drawn on the graph to shown the trend.
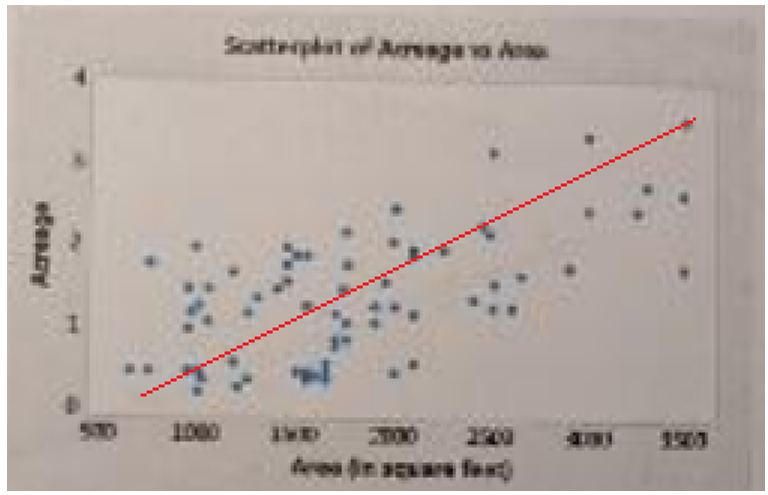
- The shape is linear because as the value in the x-axis increase the values in the y-axis also increase. Thus, the shape is linear.
- The trend is linear positive as area increase the average also increase. The trend is linearly increasing in nature.
- The association is weak because for some points there is no increase in the average even if the value of area increase.
b.
The scatterplot of High school GPA and shoe size do not show any apparent relationship, the points are scattered randomly within the horizontal band. Therefore, there is no trend or curvature on the graph.

Step by step
Solved in 3 steps with 2 images


