1. Prepare a graph of the following temperature-solubility data for aqueous barium chloride, BaCl The data plots as a curve and is not linear. Solubility, g/100g water (y axis) Temperature, °C (x axis) 31.6 33.3 10 35.7 20 40.7 40 46.4 60 52.4 80 58.8 100
1. Prepare a graph of the following temperature-solubility data for aqueous barium chloride, BaCl The data plots as a curve and is not linear. Solubility, g/100g water (y axis) Temperature, °C (x axis) 31.6 33.3 10 35.7 20 40.7 40 46.4 60 52.4 80 58.8 100

Chapter79: Solubility
Section: Chapter Questions
Problem 1P

Related questions

Question
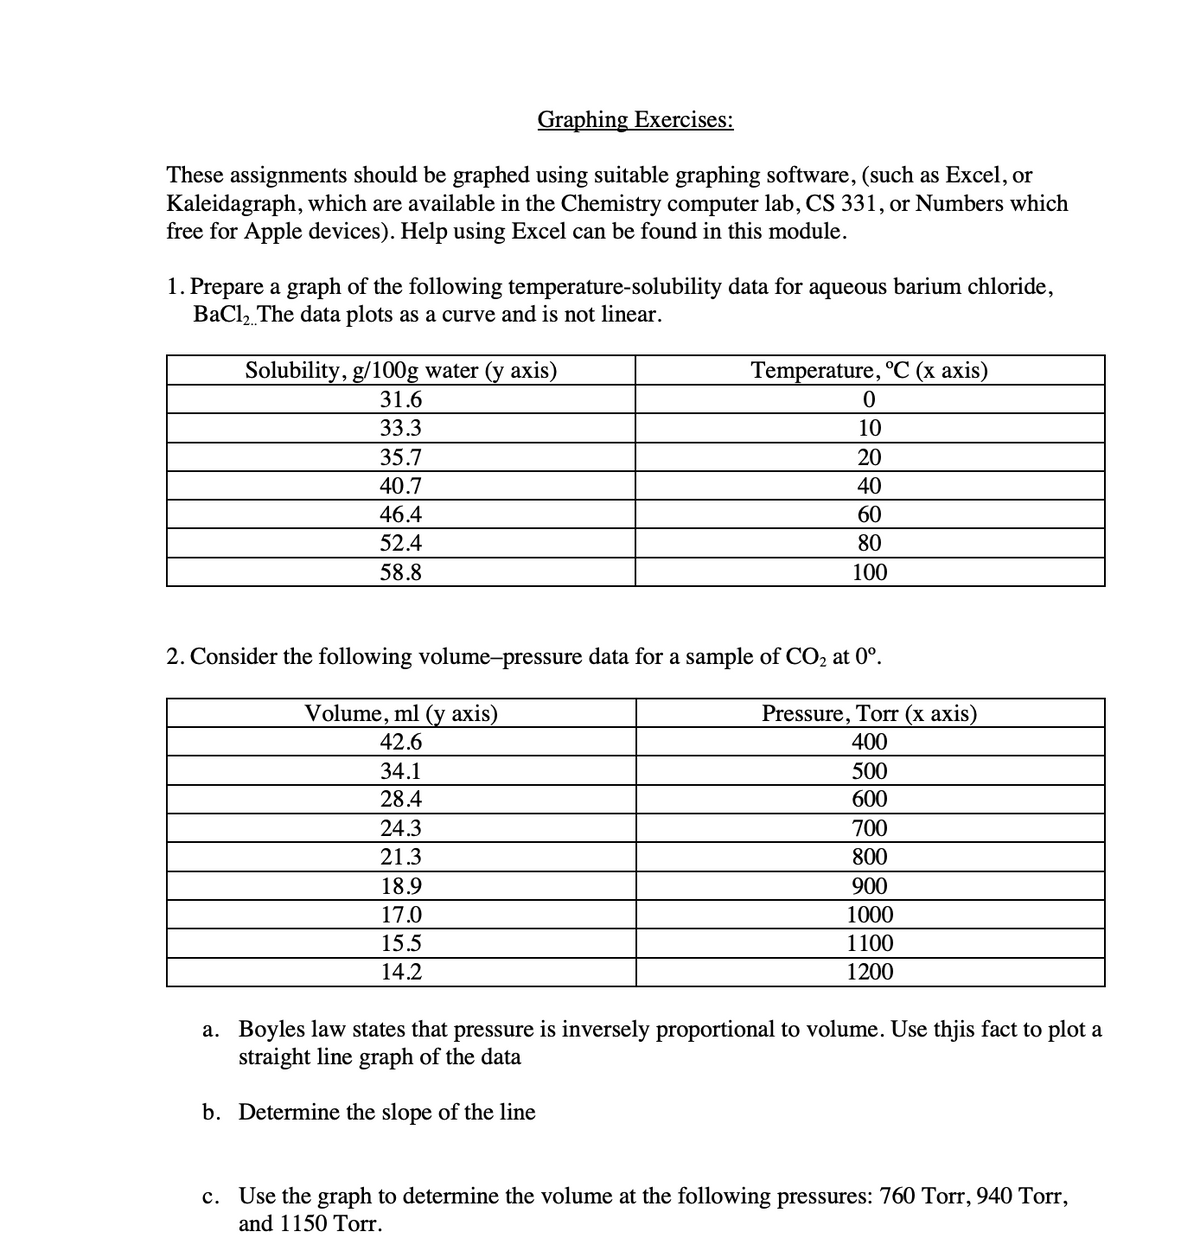
Transcribed Image Text:Graphing Exercises:
These assignments should be graphed using suitable graphing software, (such as Excel, or
Kaleidagraph, which are available in the Chemistry computer lab, CS 331, or Numbers which
free for Apple devices). Help using Excel can be found in this module.
1. Prepare a graph of the following temperature-solubility data for aqueous barium chloride,
BaCl, The data plots as a curve and is not linear.
Solubility, g/100g water (y axis)
Temperature, °C (x axis)
31.6
33.3
10
35.7
20
40.7
40
46.4
60
52.4
80
58.8
100
2. Consider the following volume-pressure data for a sample of CO, at 0°.
Volume, ml (y axis)
Pressure, Torr (x axis)
400
42.6
34.1
500
28.4
600
24.3
700
21.3
800
18.9
900
17.0
1000
15.5
1100
14.2
1200
a. Boyles law states that pressure is inversely proportional to volume. Use thjis fact to plot a
straight line graph of the data
b. Determine the slope of the line
c. Use the graph to determine the volume at the following pressures: 760 Torr, 940 Torr,
and 1150 Torr.
Expert Solution
Step 1
Hello. Since you have posted multiple questions, the first question shall only be solved in this case. If all answers are needed, resubmit the question and specify it.

Trending now
This is a popular solution!

Step by step
Solved in 2 steps with 1 images

Knowledge Booster


Learn more about
Need a deep-dive on the concept behind this application? Look no further. Learn more about this topic, chemistry and related others by exploring similar questions and additional content below.Recommended textbooks for you
EBK A SMALL SCALE APPROACH TO ORGANIC L
Chemistry
ISBN:
9781305446021
Author:
Lampman
Publisher:
CENGAGE LEARNING - CONSIGNMENT

Introductory Chemistry: An Active Learning Approa…
Chemistry
ISBN:
9781305079250
Author:
Mark S. Cracolice, Ed Peters
Publisher:
Cengage Learning

World of Chemistry, 3rd edition
Chemistry
ISBN:
9781133109655
Author:
Steven S. Zumdahl, Susan L. Zumdahl, Donald J. DeCoste
Publisher:
Brooks / Cole / Cengage Learning
EBK A SMALL SCALE APPROACH TO ORGANIC L
Chemistry
ISBN:
9781305446021
Author:
Lampman
Publisher:
CENGAGE LEARNING - CONSIGNMENT
Introductory Chemistry: An Active Learning Approa…
Chemistry
ISBN:
9781305079250
Author:
Mark S. Cracolice, Ed Peters
Publisher:
Cengage Learning
World of Chemistry, 3rd edition
Chemistry
ISBN:
9781133109655
Author:
Steven S. Zumdahl, Susan L. Zumdahl, Donald J. DeCoste
Publisher:
Brooks / Cole / Cengage Learning

Principles of Modern Chemistry
Chemistry
ISBN:
9781305079113
Author:
David W. Oxtoby, H. Pat Gillis, Laurie J. Butler
Publisher:
Cengage Learning
