27) The total blood cholesterol concentrations, in mg/dL, are shown below for a random sample of six people. In the table below, x is the age of the subject and y is the subject's total cholesterol concentration. Find the 95% prediction interval when x = 58 years. 27) x (age) 36 49 58 69 63 71 204 256 194 257 245 y (mg/dL) 209 A) Regression line: y = 1.82x +122.5 Standard error of the estimate: s est = 16.51184 Prediction interval for y(58): 159
27) The total blood cholesterol concentrations, in mg/dL, are shown below for a random sample of six people. In the table below, x is the age of the subject and y is the subject's total cholesterol concentration. Find the 95% prediction interval when x = 58 years. 27) x (age) 36 49 58 69 63 71 204 256 194 257 245 y (mg/dL) 209 A) Regression line: y = 1.82x +122.5 Standard error of the estimate: s est = 16.51184 Prediction interval for y(58): 159

MATLAB: An Introduction with Applications
6th Edition
ISBN:9781119256830
Author:Amos Gilat
Publisher:Amos Gilat
Chapter1: Starting With Matlab
Section: Chapter Questions
Problem 1P

Related questions
Question
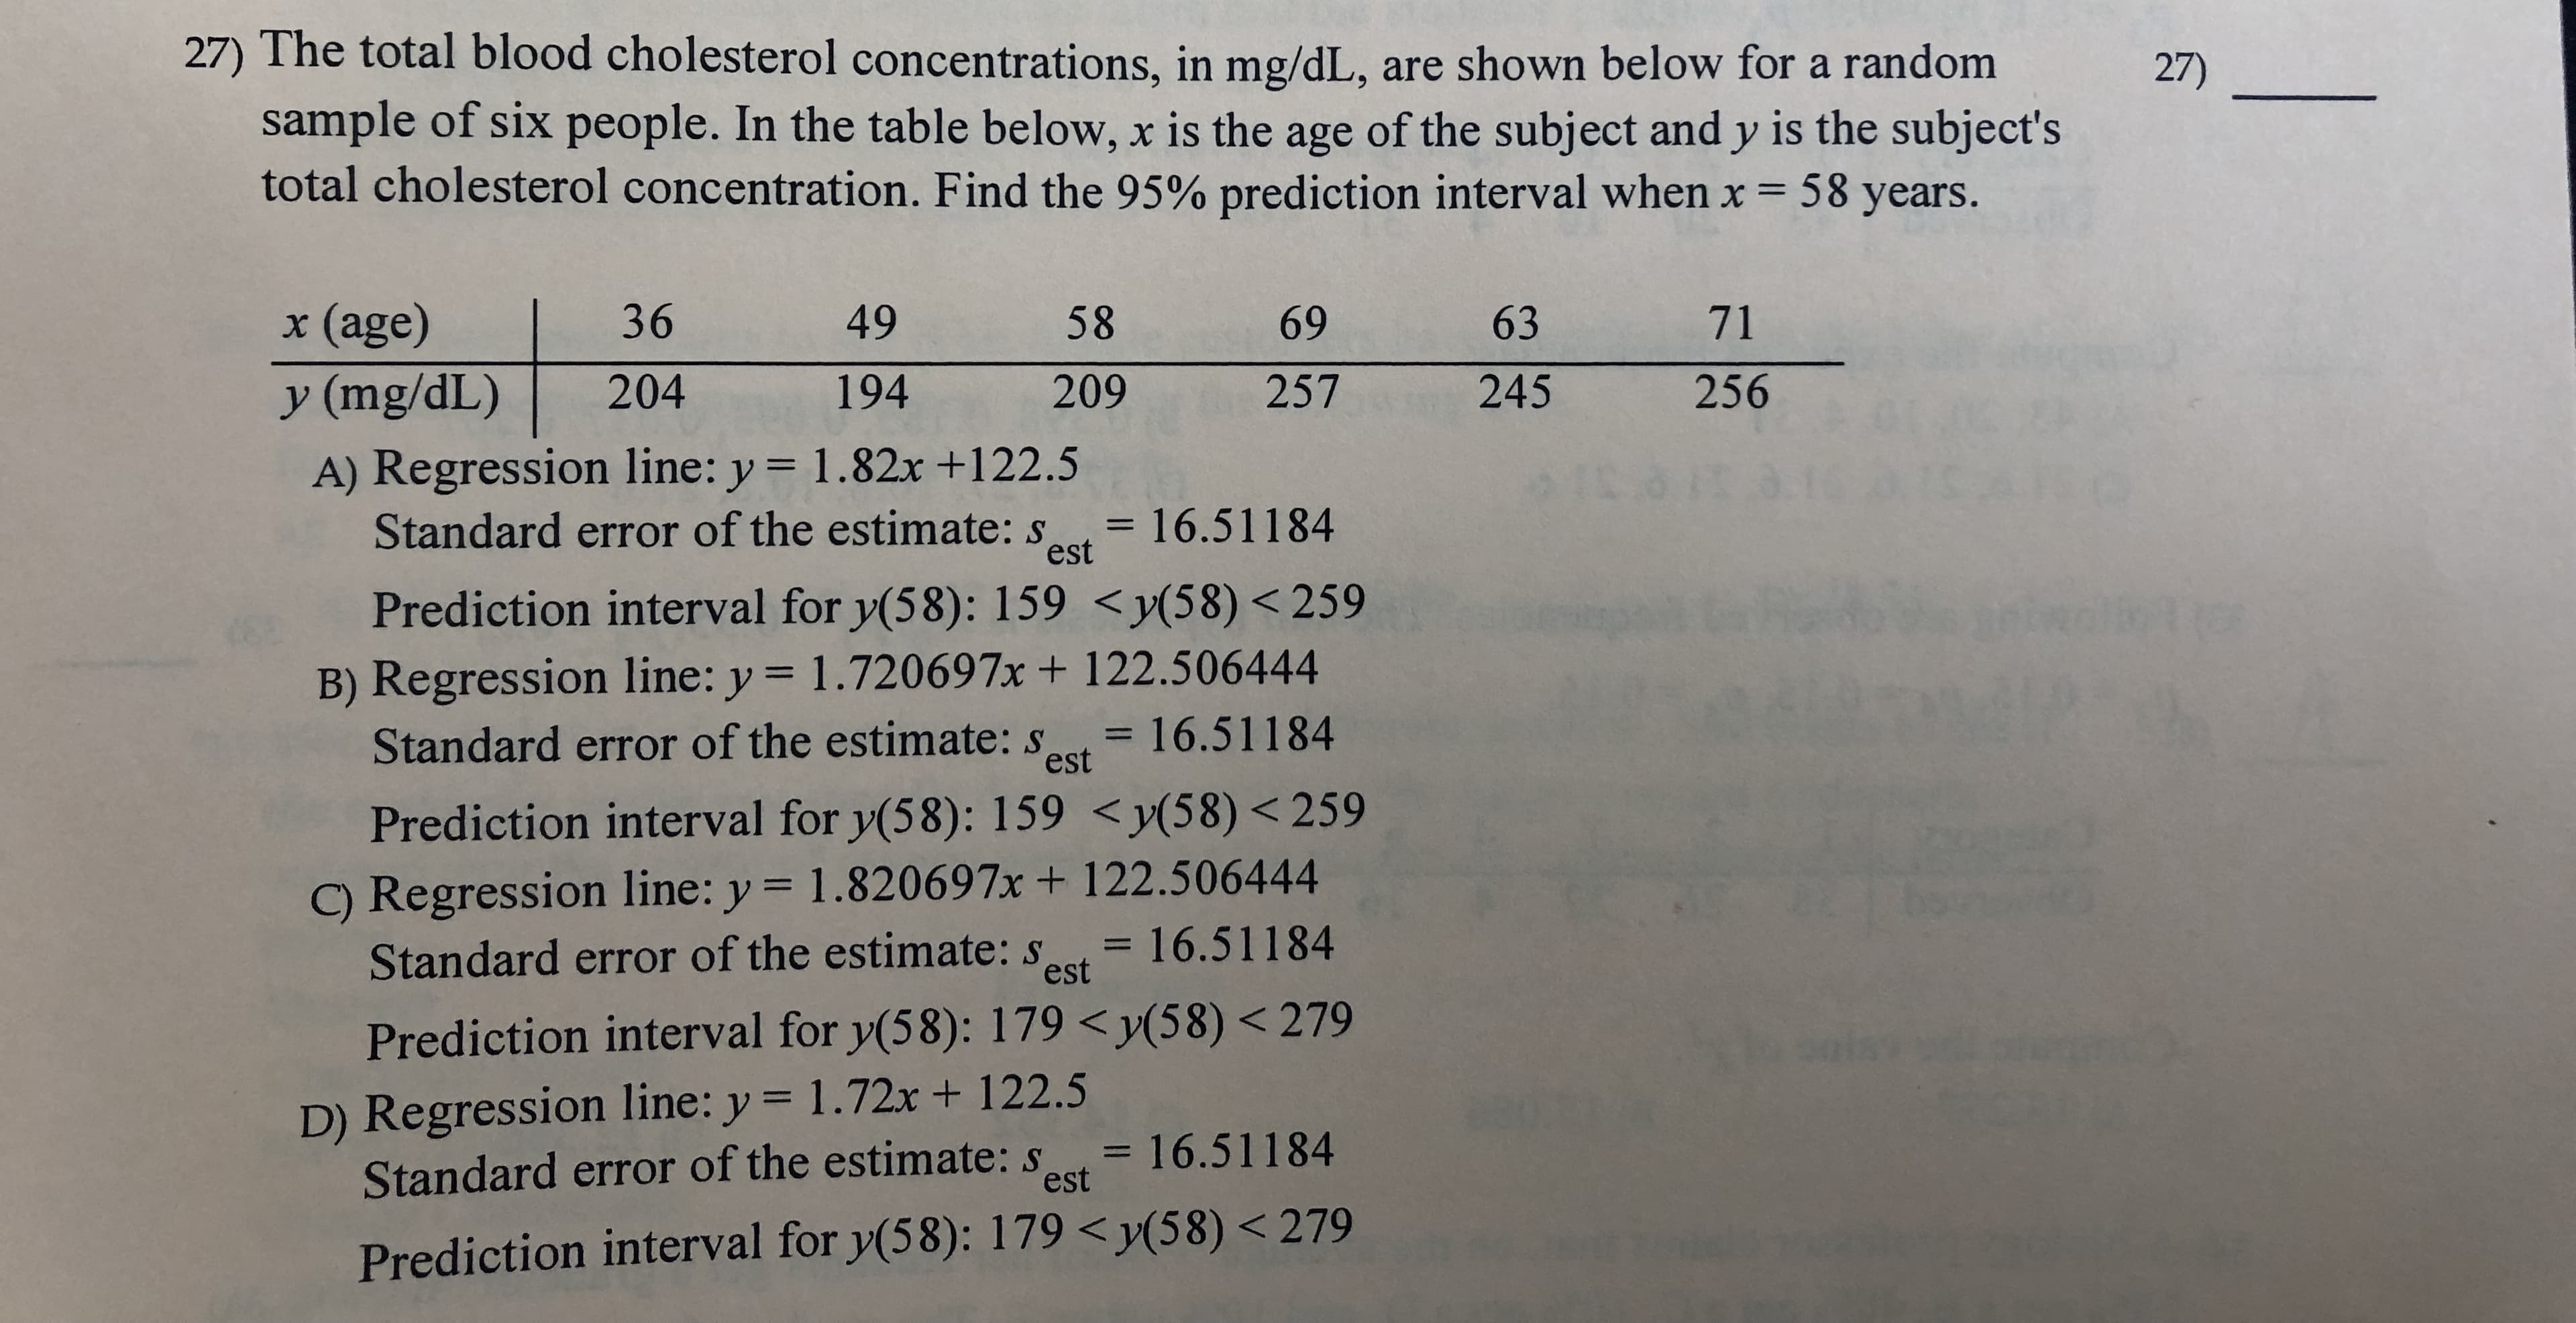
Transcribed Image Text:27) The total blood cholesterol concentrations, in mg/dL, are shown below for a random
sample of six people. In the table below, x is the age of the subject and y is the subject's
total cholesterol concentration. Find the 95% prediction interval when x = 58 years.
27)
x (age)
36
49
58
69
63
71
204
256
194
257
245
y (mg/dL)
209
A) Regression line: y = 1.82x +122.5
Standard error of the estimate: s
est
= 16.51184
Prediction interval for y(58): 159 <y(58)< 259
B) Regression line: y = 1.720697x+ 122.506444
Standard error of the estimate: s
= 16.51184
est
Prediction interval for y(58): 159 <y(58) < 259
C) Regression line: y = 1.820697x + 122.506444
Standard error of the estimate: s
= 16.51184
est
Prediction interval for y(58): 179 <y(58) < 279
D) Regression line: y 1.72x + 122.5
Standard error of the estimate: st 16.51184
est
Prediction interval for y(58): 179 <y(58) < 279
Expert Solution
This question has been solved!
Explore an expertly crafted, step-by-step solution for a thorough understanding of key concepts.

This is a popular solution!

Trending now
This is a popular solution!

Step by step
Solved in 7 steps with 6 images

Recommended textbooks for you
MATLAB: An Introduction with Applications
Statistics
ISBN:
9781119256830
Author:
Amos Gilat
Publisher:
John Wiley & Sons Inc

Probability and Statistics for Engineering and th…
Statistics
ISBN:
9781305251809
Author:
Jay L. Devore
Publisher:
Cengage Learning

Statistics for The Behavioral Sciences (MindTap C…
Statistics
ISBN:
9781305504912
Author:
Frederick J Gravetter, Larry B. Wallnau
Publisher:
Cengage Learning
MATLAB: An Introduction with Applications
Statistics
ISBN:
9781119256830
Author:
Amos Gilat
Publisher:
John Wiley & Sons Inc
Probability and Statistics for Engineering and th…
Statistics
ISBN:
9781305251809
Author:
Jay L. Devore
Publisher:
Cengage Learning
Statistics for The Behavioral Sciences (MindTap C…
Statistics
ISBN:
9781305504912
Author:
Frederick J Gravetter, Larry B. Wallnau
Publisher:
Cengage Learning

Elementary Statistics: Picturing the World (7th E…
Statistics
ISBN:
9780134683416
Author:
Ron Larson, Betsy Farber
Publisher:
PEARSON

The Basic Practice of Statistics
Statistics
ISBN:
9781319042578
Author:
David S. Moore, William I. Notz, Michael A. Fligner
Publisher:
W. H. Freeman

Introduction to the Practice of Statistics
Statistics
ISBN:
9781319013387
Author:
David S. Moore, George P. McCabe, Bruce A. Craig
Publisher:
W. H. Freeman