e) Test Statistics f) Decision g) Conclusion 3. The table below shows the number of absences in a class and the final exam grade of 7 randomly selected students. At 5% level can we say that there is a significant linear relationship between X and Y? Student 1 2 4 5 6 7 number of absences (X) 1 4 3 3 final exam grade (Y) 95 90 90 55 70 80 85
e) Test Statistics f) Decision g) Conclusion 3. The table below shows the number of absences in a class and the final exam grade of 7 randomly selected students. At 5% level can we say that there is a significant linear relationship between X and Y? Student 1 2 4 5 6 7 number of absences (X) 1 4 3 3 final exam grade (Y) 95 90 90 55 70 80 85

Big Ideas Math A Bridge To Success Algebra 1: Student Edition 2015
1st Edition
ISBN:9781680331141
Author:HOUGHTON MIFFLIN HARCOURT
Publisher:HOUGHTON MIFFLIN HARCOURT
Chapter4: Writing Linear Equations
Section: Chapter Questions
Problem 14CR

Related questions
Question
100%
Please answer e,f,g based on the given question.
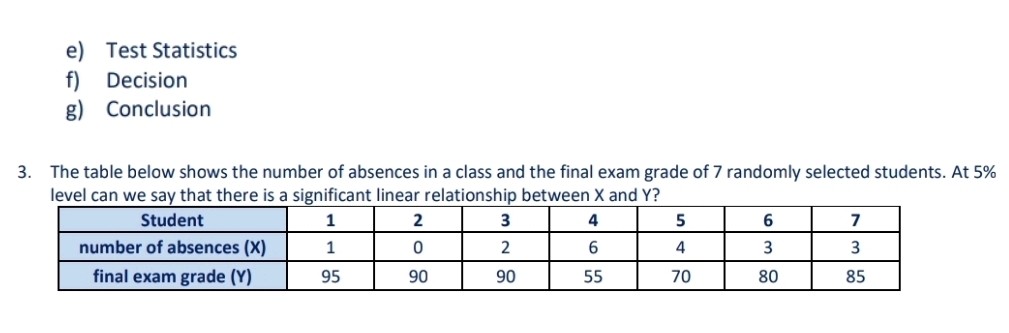
Transcribed Image Text:e) Test Statistics
f)
g) Conclusion
Decision
3. The table below shows the number of absences in a class and the final exam grade of 7 randomly selected students. At 5%
level can we say that there is a significant linear relationship between X and Y?
Student
1
2
3
4
5
6
7
number of absences (X)
1
6.
4
3
3
final exam grade (Y)
95
90
90
55
70
80
85
Expert Solution
This question has been solved!
Explore an expertly crafted, step-by-step solution for a thorough understanding of key concepts.

Step by step
Solved in 2 steps with 3 images

Recommended textbooks for you
Big Ideas Math A Bridge To Success Algebra 1: Stu…
Algebra
ISBN:
9781680331141
Author:
HOUGHTON MIFFLIN HARCOURT
Publisher:
Houghton Mifflin Harcourt
Big Ideas Math A Bridge To Success Algebra 1: Stu…
Algebra
ISBN:
9781680331141
Author:
HOUGHTON MIFFLIN HARCOURT
Publisher:
Houghton Mifflin Harcourt