4.6 The monthly sales for Telco Batteries, Inc., we lows: Month Sales January February 20 21 March 15 April 14


Q: a. Determine the regression equation. (Round to 2 decimal places.) Regression equation: ŷ = ______…
A: Below is the solution:-
Q: 4.6 The monthly sales for Yazici Batteries, Inc., were as follows: MONTH SALES January 20 February…
A: The trend projection technique depends on the understanding that the elements obligated for the past…
Q: V. Let's Explore / Let's Create 1. Discuss the other types of forecasting methods that financial…
A: Disclaimer: Since you have asked multiple question, so we will solve the first question for you. If…
Q: Analyse mckinsey 7S Framework for Zomato
A: The 7S Framework is a management tool to access the development and functioning of the business. The…
Q: The following data are for calculator sales in units at anelectronics store over the past 9 weeks:…
A:
Q: 4. An electrical contractor's records during the last five weeks indicate the number of job…
A: Forecasting is the process of estimation in which future demand is estimated based on the previous…
Q: Problem #1- The table below shows the actual sales of a Product X sold by Compa January to December…
A: This question is related to the topic -Forecasting approach and this topic falls under The…
Q: 1. The department manager using a combination of methods has forecast sales of toasters at a local…
A: The answer is as below: WE ARE ALLOWED TO DO ONE QUESTION ONLY AT AT TIME.
Q: How many columns had to be selected to create this chart? Product Line - Units Sold This year Last…
A: From the given chart the approximate values are given below.
Q: 1 Given the data below. Find the forecast value from June to December Month Actual Demand Forecast…
A: The method of least squares is a common technique in regression analysis to estimate the solution of…
Q: The Data regarding sales volume (millions of rupiah) of retail company "XMart" over the past 10…
A: Given that: Years Sale Volume 2011 15 2012 18 2013 17 2014 5 2015 25 2016 25 2017…
Q: A:0A ) الملاحظات ... 8 أبريل، ۲۰۲۱، 8:58 م Excel based modeling has grown in importance in business…
A: 1) Introduction: In today's scenario workplace is extremely dynamic involves continuous modification…
Q: List of specific weakness of each of these approaches to developing a forecast. a. Consumer…
A: a) Consumer Surveys: Consumer survey is a type of source to get information about the satisfaction…
Q: 1. Which do you think shall serve as independent variable? How about dependent variable? Why? 2.…
A: THE ANSWER IS AS BELOW:
Q: 1. Develop a 5-month moving average for the below given. What will be the forecast month 15? Compute…
A: Moving Average is an important method to forecast the estimation, based on historical data, in…
Q: 12.30. The manager of Sarah's Ice-Cream store needs an accurate forecast of the demand for…
A: Given-
Q: An electronic appliance manufacturer wants to know if there is a relationship between percentage…
A: Quarter Percent change in income Percent Change in appliance sold Quarter Percent change…
Q: 3. Weighted Moving Averages Model: Use 40% weight for the most recent data, 35% weight for the…
A: Given data is Weight 40% for most recent data, 35% for the 2nd most recent data, and 25% for the…
Q: Sales of Cool-Man air conditioners have grown steadily during the past 5 years: (Round your ans to 2…
A: Case 1: As per the given table Following is the excel solution: Following are the formulas used:…
Q: 1 39 44 40 4 45 38 43 7 39 a) Forecast sales using 4-week weighted moving averages with weights…
A: A) The weights of the 4 periods are respectively 0.4,0.3,0.2,0.1 and their sum is 1Calculation of 4…
Q: 13 U) 977 is 88 978 is 93 979 is 99 980 is 109 00 units se estimate the value of demand for next 3…
A: THE ANSWER IS AS BELOW:
Q: 5. Perform a least-squares regression analysis on Leslie's data. 6. Using the regression output,…
A: THE ANSWER IS AS BELOW:
Q: 4. Simple Exponential Smoothing: Use a smoothing parameter, α = 0.3. Month Ft 1 2 3 4 5 678 9 10 No.…
A: Exponential smoothing is a forecasting model which using the actual demand and forecasting f=demand…
Q: Whai is Time-series forecasts?
A: Forecasting is the process of identifying the demand accurately for future production planning and…
Q: 2.The following data gives sales of the company for various years. Fit the straight line and…
A: The question is related with least square method The two equations under least square method are Y…
Q: Determine the Mean Absolute Deviation Using a- 0.20. Period Demand Forecast 20 35 20 46 23 4 40…
A: Mean Absolute Deviation (MAD) indicating the average value of absolute errors. Absolute error is the…
Q: Compute the one-step-ahead three-month and six-month moving-average forecastsfor July through…
A: The techniques of forecasting give the complete idea of the trend is known as moving average…
Q: Given the following data of actual sales and forecast for the five months: Month 1, Month 2, Month…
A: Given data is
Q: The following table gives the number of pints of type A blood used at Damascus Hospital in the past…
A: Moving average method is quite possibly the most famous quantitative techniques utilized sought…
Q: Sales of Volkswagen’s popular Beetle have grown steadilyat auto dealerships in Nevada during the…
A: Table: YEAR SALES FORECAST 1 450 410 2 495 3 518 4 563 5 584 6 ?…
Q: 4,23 Sales of vegetable dehydrators at Bud Banıs's dis- count department store in St. Louis over the…
A: Month 2009-10 Management's forecast July 100 August 93 September 96 October 110…
Q: From the following time series data of sale project the sales for the next three years. Year 2001…
A: Given sales data- Years Sales (In 000's) 2001 80 2002 90 2003 92 2004 83 2005 94 2006…
Q: 101 Management's Forecast 122 114 a) What is the MAD for the forecast developed by management sales…
A: MAD shows the average deviations of the forecasted values in comparison to actual sales. MAPE is…
Q: 2. National Scan, Inc., sells radio frequency inventory tags. Monthly sales for a seven-month period…
A: Forecasting is the process of estimating the future demand using the previous or historic data of…
Q: (1)The naive approach. (2)A five-month moving average. (3)A weighted average using .60 for August,…
A: Forecasting is the process in which future predictions are made according to the previous and…
Q: Suppose these data show the number of gallons of gasoline sold by a gasoline distributor in…
A: Given data is
Q: 4. A local moving company has collected data on the number of moves they have been asked to perform…
A: THE ANSWER IS AS BELOW:
Q: a) Using the trend-projection (regression) method, develop a forecastfor the sales of Volkswagen…
A: Note: - Since the data for the 'Volkswagen Beetles' question is not given we will answer the…
Q: B. The owner of a small hardware store has noted a sales pattern that seems to parallel the number…
A:
Q: 4.1 The following gives the number of pints of type A blood used at Woodlawn Hospital in the past 6…
A: Forecasting is the process of determining future sales with estimation using previous or historic…
Q: The actual demand for the patients at EYE OPD of KTH for the first six weeks of this year follows…
A: Given that: Week Actual Number of Patients 1 65 2 62 3 70 4 48 5 63 6 52
Q: c. Comment on the strength of the relationship between the test scores and production ratings. The…
A: Coefficient of correlation = R Coefficient of Determination = R^2
Q: by X company is given below. sdund Forecast the demand for the pumps for the next three years. Year…
A: Below is the solution:-
Q: A newly operated company producing household items would want to forecast its sales volume for the…
A: Find the Given details below: Given Details Month Sales (Quantity) 1 300280 2 290295 3…
Q: Which one of the forecasting methods is capable of handling large amounts of data and uncovering…
A: Forecasting: It is a method that practices historical data as inputs to make knowledgeable…
Q: Bradley's Copiers sells and repairs photocopy machines. The manager needs weekly forecasts of…
A: Given data-
Q: 3. National Mixer, Inc., sells can openers. Monthly sales for a seven-month period were as follows:…
A: Note: - Since we can answer only up to three subparts we will answer the first three subparts (a, b…
Q: Make a 15-year simple linear regression forecast. Example: Railroad Products Co. RPC…
A: Given data is
Question 4.6
A-C


Trending now
This is a popular solution!

Step by step
Solved in 4 steps with 1 images

- 2)Auto sales over a 4-month period were forecasted as follows: 89, 98, 105, and 97. The actual results over the 4-month period were as follows: 92, 96, 101, and 100. What was the MAD of the 4-month forecast? (use an excel sheet to make all calaculations and show formulas used in excel)The table shows the values found in the error analysis. What method of forecasting would be best to use? What is the forecasted value? MSE forecast for week 13 Time Series 1.08 14.76 3-week MA 3.04 13.67 exp smoothing 11.04 9.5 Group of answer choices A.) Time Series, forecasted value = 14.76 B.) 3-week MA, forecasted value = 13.67 C.) exp smoothing, forecasted value = 9.5 D.) Time Series, forecasted value = 1.08 E.) 3-week MA, forecasted value = 3.04 F.) exp smoothing, forecasted value = 11.04a. what are forecasts? b. what are the costs associated with forecasting, and with not forecasting?
- What forecasting technique makes use of written surveys or telephone interviews? Historical analogy, Delphi method, Marketing research, Ad hoc forecasting, or Collaborative forecasting? 2 Which qualitative forecasting technique was developed to ensure that the input from every participant in the process is weighted equally? Historical analogy, Delphi method, Marketing research, Ad hoc forecasting, or Collaborative forecasting? 3 When forecasting demand for new products, sometimes firms will use demand data from similar existing products to help forecast demand for the new product. What technique is this an example of? Historical analogy, Delphi method, Marketing research, Ad hoc forecasting, or Collaborative forecastingwhich of the following are charactersitics of qualitative forecasting methods? 1. Function of past data,2. Non numerical data , 3. useful when past data is avaialable , based on 4. broad range of knowledge , personal judgement, and intuition?why forecasting is needed in business a. to ascertain resource requirements b. to project profit c. to identify business scenarios d. all of the above
- D.) compute MAPE for each data set. Which forecast appears to be more accurate?Describe the use of forecasting in compiling a technical document?10 Community General Hospital finds itself treating many bicycle accident victims. Data from the last seven 24-hour periods is shown below: Day Bicycle Victims 1 8 2 14 3 8 4 14 5 18 6 15 What is the forecast for day 4 using a 3-period moving average model? (1 mark) (Round to two decimal places). 11 What is the forecast for day 5 using a 3-period moving average model? (Round to two decimal places). 12 What is the forecast for day 6 using a 3-period moving average model? (1 mark) (Round to two decimal places). 13
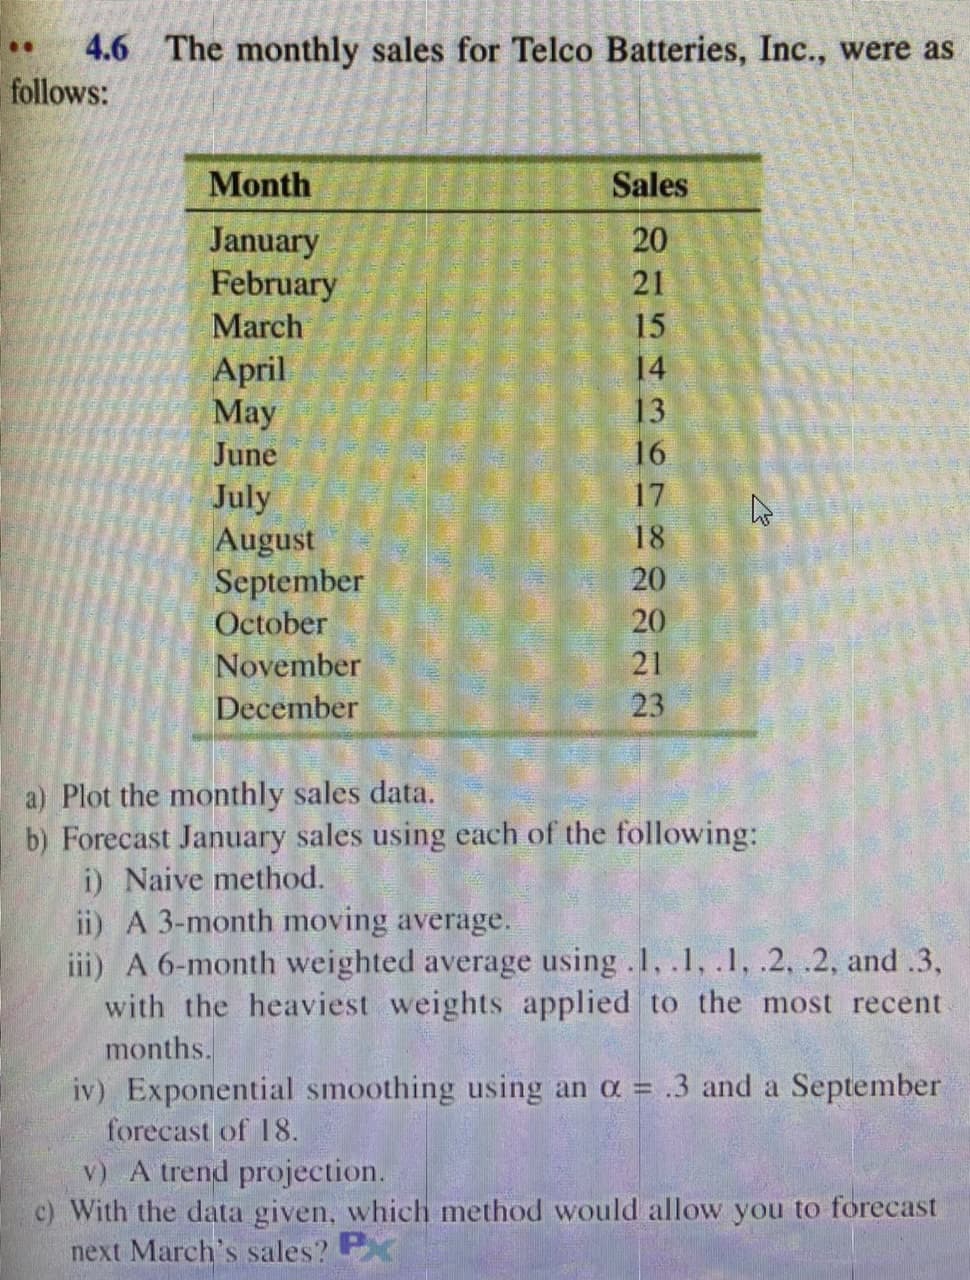
- The monthly sales for Yazici Batteries, Inc., wereas follows: a) Plot the monthly sales data.b) Forecast January sales using each of the following:i) Naive method.ii) A 3-month moving average.iii) A 6-month weighted average using .1, .1, .1, .2, .2, and.3, with the heaviest weights applied to the most recentmonths.iv) Exponential smoothing using an a = .3 and aSeptember forecast of 18.v) A trend projection.c) With the data given, which method would allow you toforecast next March’s sales?a. What is the mean square error for time periods 2 through 4 using the average forecasting method? b. What is the mean absolute error for time periods 2 through 4 using the average forecasting method? c. What is the mean absolute percentage error for time period 2 through 4 using the average forecasting method? Round all answers to two decimal places. Time Period 1 2 3 4 Mean absolute error (MAE) Mean squared error (MSE) Mean absolute percentage error (MAPE) Electric Bill 510 315 420 480 Average Forecast Forecast ErrorCorporate triple-A bond interest rates for 12 consecutive months follow. Month 1 2 3 4 5 6 7 8 9 10 11 12 Value 9.5 9.3 9.4 9.6 9.8 9.7 9.8 10.5 9.9 9.7 9.6 9.6 a. Construct a time series plot. What type of pattern exists in the data? b. Develop the three-month moving averages for this time series. Compute MSE. c. Compute MAE. d. Compute MAPE. e. What is the three-month moving average forecast for the next month (month 13)?
