Sales of Cool-Man air conditioners have grown steadily during the past 5 years: (Round your ans to 2 decimal places.) Forecast Forecast Year Sales (a = 0.30) (a = 0.90) 1 450 410.0 410.00 495|| 3 518 470.60 490.10 563
Sales of Cool-Man air conditioners have grown steadily during the past 5 years: (Round your ans to 2 decimal places.) Forecast Forecast Year Sales (a = 0.30) (a = 0.90) 1 450 410.0 410.00 495|| 3 518 470.60 490.10 563

Practical Management Science
6th Edition
ISBN:9781337406659
Author:WINSTON, Wayne L.
Publisher:WINSTON, Wayne L.
Chapter13: Regression And Forecasting Models
Section13.7: Exponential Smoothing Models
Problem 26P: The file P13_26.xlsx contains the monthly number of airline tickets sold by the CareFree Travel...

Related questions

Question
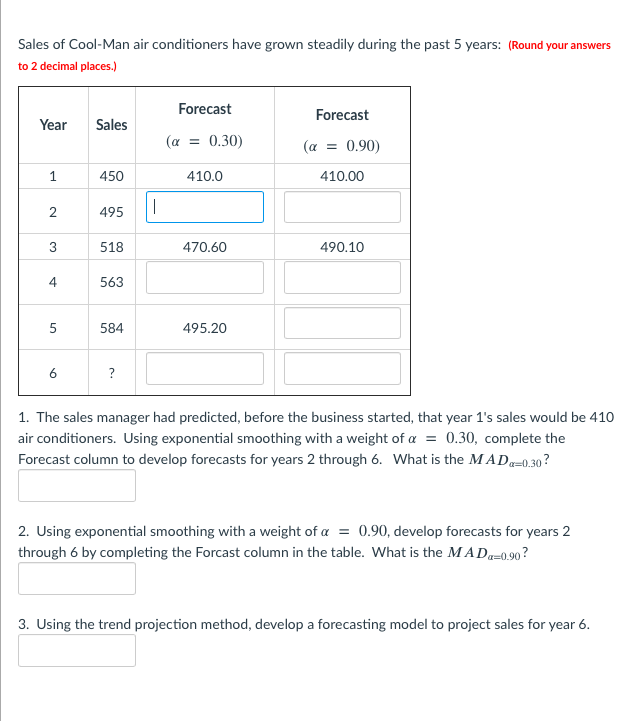
Transcribed Image Text:Sales of Cool-Man air conditioners have grown steadily during the past 5 years: (Round your answers
to 2 decimal places.)
Forecast
Forecast
Year
Sales
(a = 0.30)
(a
0.90)
1
450
410.0
410.00
495
3
518
470.60
490.10
4
563
5
584
495.20
6
?
1. The sales manager had predicted, before the business started, that year 1's sales would be 410
air conditioners. Using exponential smoothing with a weight of a
= 0.30, complete the
Forecast column to develop forecasts for years 2 through 6. What is the MADa=0.30 ?
2. Using exponential smoothing with a weight of a = 0.90, develop forecasts for years 2
through 6 by completing the Forcast column in the table. What is the MAD-0,90 ?
3. Using the trend projection method, develop a forecasting model to project sales for year 6.
2.
Expert Solution
This question has been solved!
Explore an expertly crafted, step-by-step solution for a thorough understanding of key concepts.

This is a popular solution!

Trending now
This is a popular solution!

Step by step
Solved in 3 steps with 10 images

Knowledge Booster


Learn more about
Need a deep-dive on the concept behind this application? Look no further. Learn more about this topic, operations-management and related others by exploring similar questions and additional content below.Recommended textbooks for you
Practical Management Science
Operations Management
ISBN:
9781337406659
Author:
WINSTON, Wayne L.
Publisher:
Cengage,
Practical Management Science
Operations Management
ISBN:
9781337406659
Author:
WINSTON, Wayne L.
Publisher:
Cengage,