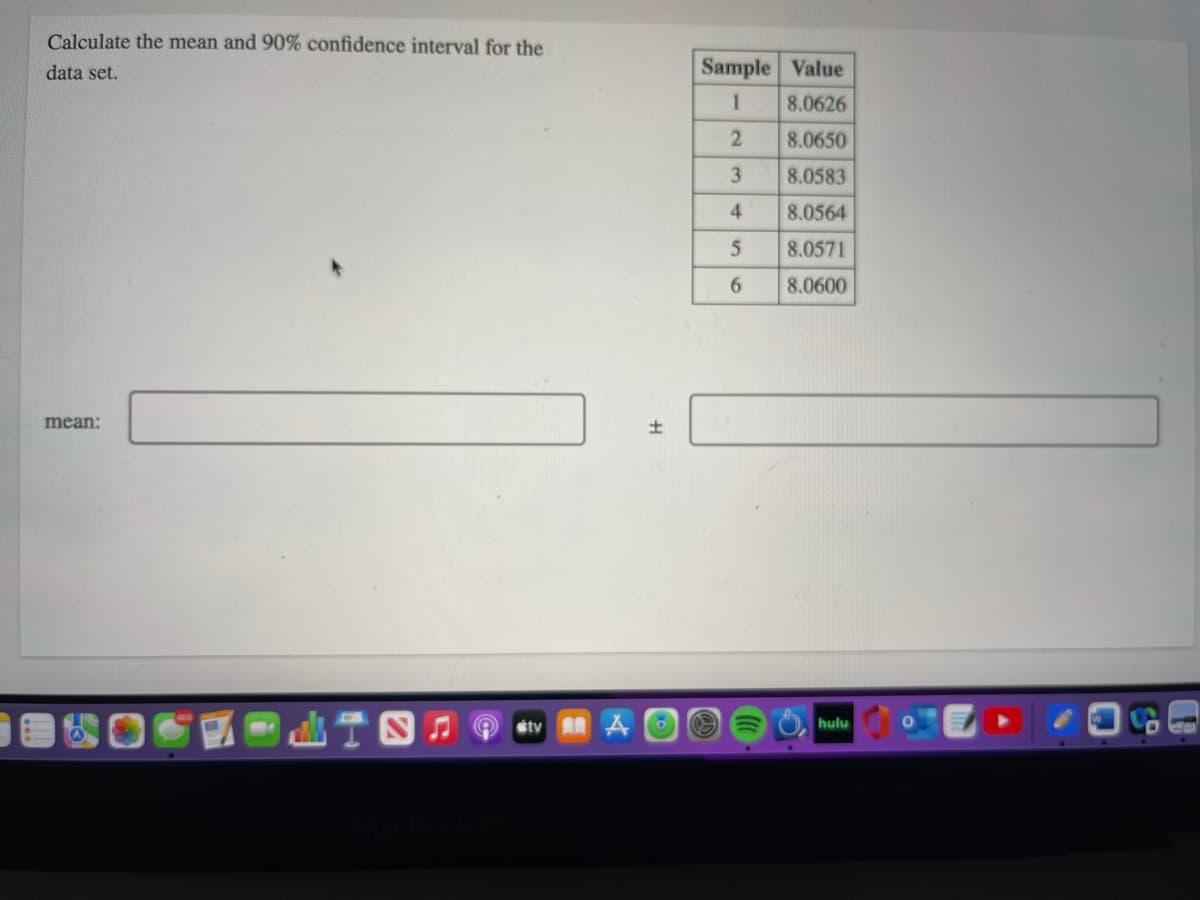
Calculate the mean and 90% confidence interval for the data set. Sample Value 8.0626 8.0650 3 8.0583 4 8.0564 8.0571 6. 8.0600 mean: 山T四月@ stv A hulu


Q: Identify whether the following are examples of systematic or random error or are mistakes: a. Using…
A: The random error causes one measurement to differ slightly from the next. It comes from…
Q: 45. Normal temperature again From the measurements of body temperature in Chapter 14, Exercise 29,…
A:
Q: 1) Perform the indicated mathematical operations. State the uncertainty of the final answer a…
A: Uncertainty is the measure of mathematical value which is deviated very little from measured value.
Q: Calculate the average density (3 s.f.) in (g/mL) of her unknown solid. Average density (g/mL) = %3D
A: Formula to calculate density : Density= mass/Volume
Q: For the following data, calculate mean, deviation, standard deviation, median, variance and range (…
A: For a set of data the mean, deviation, standard deviation, median, variance and range can be…
Q: Arrange the values according to magnitude. Greatest Least Answer Bank 7.6 x 10⁻⁶ 3.3 x 10⁻² 9.0 x…
A: The value which is more than zero ( > 0 ) has the greatest magnitude and the Value which is less…
Q: For the numbers 116.0, 97.9, 114.2, 106.8 and 108.3, find the range and 90% confidence interval for…
A:
Q: Using the Q test, decide whether the value 222 should be rejected from the set of results: 193, 222,…
A: Dixon's Q test or Q test, is used for identification and rejection of outliers from the given…
Q: Find the median of the following data: 160, 180, 200, 280, 300, 320, 400 а. 200 b. 240 С. 280
A:
Q: Analysis of several plant-food preparations for potassium ion yielded the following data: Sample…
A:
Q: Which of the following correlation coefficients indicates the strongest relationship between…
A: The value of correlation coefficients ranges from -1 to +1 . the strongest relationship between the…
Q: Data from M. J. Samide, J. Chem. Ed. 2004, 81, 1641. (a) Do the volumes delivered by student 1 from…
A: a. First calculate the volumes delivered by student 1 from burette. Mean volume (V¯) = 10.01 ml No.…
Q: For the numbers 116.0, 97.9, 114.2, 106.8 and 108.3, find the rangeb and 90% confidence interval for…
A:
Q: AA (mg/g) UV (ug/ml) Sample (ug/ml) Unknown Fe solution 1 Unknown Fe solution _2 0.322 8.136 0.318…
A: Mean, standard deviations, confidence limit are calculated using respective formulas. We can't use…
Q: Explain the difference between random sampling and haphazard sampling as used in Analytical…
A: To find: The difference between random sampling and Haphazard sampling
Q: What is the absolute error of the answer for the following operation? (8.12 +- 0.03)-(3.12+-0.02) =…
A: The operation given is, =>
Q: Find the median of the following data: 160, 180, 200, 280, 300, 320, 400 a. 280 b. 200 С. 240
A:
Q: 6) A set of volumetric calibration measurements give observed values of (mL): 4.995 5.004 4.998…
A: #6: We use the formula below to find the confidence interval level: Confidence Interval = t*sn where…
Q: Given the following data, calculate the 95% confidence interval. 0.452 0.453 0.448 0.456…
A: Given , Average = 0.4534 Standard deviation = 0.003847
Q: A student determines the density of a metal to be 8.55g/cm3. If the theoretical value is 8.91g/cm3,…
A:
Q: Two laboratory stafftitrated a 50.00 mL of hydrochloric acid with an unknown concentration with a…
A:
Q: An analysis of city drinking water for total hardness was done by two students in the laboratory and…
A: We are given data : For student A: 228.3, 226.4, 226.9, 227.1, and 228.6. And For student B:…
Q: Fraction no. Elution Vol. (mL) Abs (λ = 410) Fraction no. Elution Vol.…
A:
Q: 1. Make sure you know how to obtain the highlighted results from the given information. Molar…
A: Hi, Since you have asked multiple questions (two tables), we will solve the first question for you.…
Q: 2. As the director of a research laboratory you are paid to decide if there is a significant…
A:
Q: A set of samples from an abandoned industrial site detected a suspected groundwater contaminant at a…
A:
Q: -). A new procedure for determining cholesterol in blood serum was used with a NIST standard sample…
A:
Q: Calculate the 95% confidence interval for these set of data: 3.3,3.4,3.1 and 3.6 ppm
A:
Q: What is the meaning of a confidence interval?
A: In chemistry there are many ways to check the deviation of experimental data from the accurate…
Q: Concentration 3006 2901 2892 Absorbance std 0.540 0.540 0.540 Absorbance sx 0.555 0.526 0.540 100.3…
A: Here for calculation of % potency one has to put all required data on that formula and compute .
Q: Volumetric Target concentration Mass of mixture Amount of ammonia flask added required 0.43 gl)…
A:
Q: A certified reference material of lead in calcium carbonate is analyzed by a laboratory and found to…
A:
Q: A student determines the concentration of an unknown sample using two different methods. Each method…
A: Comparing the given data by creating a comparison table: Observations Method 1 Method 2…
Q: What is the 95% confidence interval for the mean of the data, assuming
A: (χi - μ) (χi - μ)2 1 3.55 0.10 0.010678 2 3.65 0.20 0.041344 3 3.14 -0.31 0.094044 Mean…
Q: A set of samples from an abandoned industrial site detected a suspected groundwater contaminant at a…
A:
Q: Calculate the 95% confidence interval for these set of data: 3.2, 3.3, 3.4, 3.3, 3.4 and 3.5 ppm
A:
Q: 7-6. The last result in each set of data in Problem 7-4 may be an outlier. Apply Q test (95%…
A: By applying Q-test we can easily find whether the data point in question is an outlier or not. If…
Q: 200 180 160 140 120 100 40 20 PPM | (+) drta 3 Peak ára 2 penk 2 10 PPM
A: 13C-NMR provides the information about the number and types of carbons of unknown. 1H-NMR provides…
Q: Which of the following is not a way of expressing data reliability: Statistical Tests Sampling…
A: A question based on tools in analytical chemistry that is to be accomplished.
Q: If the mean value of certain set of eight measurements was 45.74, and standard deviation S=0.35.…
A:
Q: 2. As the director of a research laboratory you are paid to decide if there is a significant…
A: Given: Hence we have to find out whether there is any difference between two sets of data or not .…
Q: 1. Calculate the experimental density of a salt solution and the percent error (same as relative…
A: The experimental density of a salt solution is to be calculated. The percent error is to be…
Q: A chemist working in a hospital clinical laboratory obtained the following values for uric acid in…
A: The given values are 4.63, 4.58, 4.82, 4.31, 4.67 and 4.60 mg To find: Mean value
Q: Find the mean and median of each of the following sets of data. Determine the deviation from the…
A: The following set is given: 0.0110, 0.0104, 0.0105 Mean of the given data: Mean is the average of a…
Q: Certified Reference Material (CRM), GSS-5, is certified to contain 40.67 ± 3.33 mg/kg of Ni in soil.…
A:
Q: What will happen to the sample size if the percentage error becomes lower e.g. 5% instead of 10%?…
A: A question based on tools in analytical chemistry that is to be accomplished.
Q: STATISTICAL DATA IN CHEMICAL ANALYSIS: Calculate the mean and standard deviation of the data below.…
A:
Q: What is the relative error in the determination of a density for which the accepted value is 0.945…
A: Relative error = |accepted value - experimental value|/accepted value
Q: c. The relative deviation (d,) of a measurement or experimental data is the deviation divided by the…
A: Given that, xi=17.34%,17.33%,17.28%,17.29%,17.36% Calculate relative deviation of 17.29%Cu(in ppt)…

Step by step
Solved in 2 steps with 2 images

- The following molarities were calculated from replicate standardization of a solution: 0.5006, 0.5003, 0.5023, 0.5009, 0.5015, 0.5013, and 0.5022 M. Assuming no determinate errors, what is the upper limit of the 95% confidence interval?The following molarities were calculated from replicate standardization of a solution: 0.5022, 0.5022, 0.5021, 0.5008, upper limit of the 95% confidence interval?Plot the following data and perform linear regression to obtain the value of the slope, the value of the y-intercept, and the correlation coefficient r. x- axis y-axis ln(0) 4.6052 0.0000 3.8712 0.6931 3.4012 1.0986 2.7081 1.3863 2.1972 1.6094 1.7918 1.7918 1.0986 1.9459 0.0000
- An analyst obtained the following data for the percent compound Z in triplicates (n=3) of an insecticide preparation: 7.47, 6.98, and 7.27. Calculate the 90% confidence limit for the mean of the data assuming that only information about the precision of the method is the precision for the three data points.y= mx+ b Slope () = -4E-09 y-intercept () = 0.4021 and OD= 0.540 , Calculate the concentration (x)Calculate the following exercise with correct sig figs: ((2.9365mL - 3.00mL)/3.00mL)x100%
- A chemist obtained the following data for the percent compound Z in triplicates (n=3) of an insecticide preparation: 7.47, 6.98, and 7.27. Calculate the 90% confidence limit for the mean of the data assuming that only information about the precision of the method is the precision for the three data points.What do you understand by Isocratic and Gradient elution?A standard solution was prepared containing 10.0 ppm of an analyte and 15.0 ppm of an internal standard. Analysis of the sample gave signals for the analyte and internal standard of 0.155 and 0.233 (arbitrary units), respectively. Sufficient internal standard was added to an unknown sample to make it 15.0 ppm in the internal standard. Analysis of the unknown sample yielded signals for the analyte and internal standard of 0.274 and 0.198, respectively. Calculate the concentration of analyte in the unknown sample.
- 5 0.0030 0.0015 0.0005 6 0.0030 0.0057 0.0089 7 0.0086 0.0057 0.0089 Show the Calculations of Qc and Kc for Exp. 5-7 Please help me out. ThanksI have set up my spreadsheet using this sample data and reproduced the result with a pKa of 4.64. true or falseMeasurements of boiling temperatures of samples of a liquid (°C) are given below: 78.4 79.0 78.8 79.2 78.6 Calculate the meanCalculate the modeCalculate the standard deviation
