
MATLAB: An Introduction with Applications
6th Edition
ISBN: 9781119256830
Author: Amos Gilat
Publisher: John Wiley & Sons Inc
expand_more
expand_more
format_list_bulleted
Related questions
Question
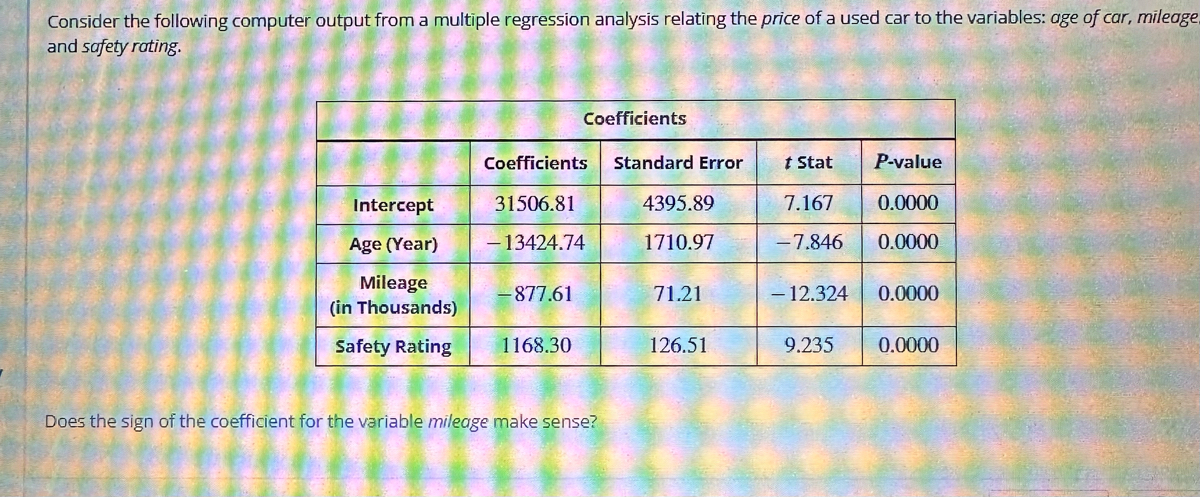

Transcribed Image Text:Consider the following computer output from a multiple regression analysis relating the price of a used car to the variables: age of car, mileage.
and safety rating.
Intercept
Age (Year)
Mileage
(in Thousands)
Safety Rating
Coefficients
31506.81
- 13424.74
-877.61
Coefficients
1168.30
Does the sign of the coefficient for the variable mileage make sense?
Standard Error
4395.89
1710.97
71.21
126.51
t Stat
7.167
-7.846
- 12.324
9.235
P-value
0.0000
0.0000
0.0000
0.0000

Transcribed Image Text:OYes, because it is expected that as mileage increases then the price should also increase.
O No, because it is expected that as mileage increases then the price should decrease.
O No, because it is expected that as mileage increases then the price should also increase.
O Yes, because it is expected that as mileage increases then the price should decrease.
h
Keyboard Shortcuts
Expert Solution
This question has been solved!
Explore an expertly crafted, step-by-step solution for a thorough understanding of key concepts.

This is a popular solution

Trending nowThis is a popular solution!

Step by stepSolved in 3 steps

Knowledge Booster

Similar questions
- In the above regression of air quality on other variables in question 2, R-squared is 0.3829. How do you interpret it?arrow_forwardThe following data gives the number of employees at the bookstore and the number of minutes students wait in line to buy books at the beginning of the term. The independent variable is the number of employees and the dependent variable is the number of minutes. What is the y intercept? SSxx = 56.857; SS=2095.714; SSxy=-322.571 SUMMARY OUTPUT Regression Statistics Multiple R R Square Adjusted R Square XA356899 0.96 0.93 0.91 y 67 54 47 33 31 25 12arrow_forwardPlease answer... I'm needed only 1 hours time to dd .... Thank uarrow_forward
- The following regression is fitted using variables identified that could be related to student requestedloan amount, LOAN-AMT($) for returning students of a certain University. ????−??? = ? + ? ?????? + ? ???? + ? ????Where ACCEPT = the percentage of applicants that was accepted by the university, PREV = previous loan amount and OUTS =outstanding loan amountThe data was processed using MNITAB and the following is an extract of the output obtained:EXHIBIT 2Predictor Coef StDev T PConstant -26780 6115 * 0.000ACCEPT 116.00 37.17 3.14 0.003PREV -4.21 14.12 -0.30 **OUTS 70.85 15.77 4.49 0.000S = 2685 R-Sq = 69.6% R-Sq(adj) = 67.7%Analysis of VarianceSource DF SS MS F PRegression 3 808139371 269379790 37.37 0.00Residual Error 49 353193051 7208021Total 52 1161332421a)What is dependent and independent variables? b)Fully write out the regression equation c)What is the sample size used in this investigation? d)Fill in the blanks identified by ‘*’ and ‘**’. e)Is β significant, at the 5% level of…arrow_forwardHi, please help with this assignment. Please show the work step by step as I am having trouble understanding how to compute them.arrow_forwardListed below are systolic blood pressure measurements (in mm Hg) obtained from the same woman. Find the regression equation, letting the fight arm blood pressure be the predictor (x) variable. Find the best predicted systolic blood pressure in the left arm given that the systolic blood pressure in the right arm is 90 mm Hg. Use a significance level of 0.05. Right Arm Left Arm % 102 101 94 80 79 177 172 143 143 143 Click the icon to view the critical values of the Pearson correlation coefficient r The regression equation is y=+x. (Round to one decimal place as needed.). Given that the systolic blood pressure in the right arm is 90 mm Hg, the best predicted systolic blood pressure in the left arm is mm Hg. (Round to one decimal place as needed) M H N H & C Copyright ©2022 Pearson Education Inc. All rights reserved. | Terms of Use | Privacy Policy | Permissions | Contact Us | a 33 M 0 8 K Vi 1. fio 11 O More (2) { 87°F Next [ insert prt sc 7:46 8/5/2 backspacearrow_forward
- Listed below are systolic blood pressure measurements (in mm Hg) obtained from the same woman. Find the regression equation, letting the right arm blood pressure be the predictor (x) variable. Find the best predicted systolic blood pressure in the left arm given that the systolic blood pressure in the right arm is 90 mm Hg. Use a significance level of 0.05. Right Arm 101 100 92 75 75 O Left Arm 174 167 181 149 147 Click the icon to view the critical values of the Pearson correlation coefficient r The regression equation is y = + x. (Round to one decimal place as needed.) Given that the systolic blood pressure in the right arm is 90 mm Hg, the best predicted systolic blood pressure in the left arm is mm Hg. (Round to one decimal place as needed.)arrow_forwardThe local utility company surveys 12 randomly selected customers. For each survey participant, the company collects the following: annual electric bill (in dollars) and home size (in square feet). Output from a regression analysis appears below: Bill 13.45 + 4.39*Size Coefficients Estimate Std. Error (Intercept) 13.45 Size 4.39 0.54 0.2 We are 90% confident that the mean annual electric bill increases by between dollars and dollars for every additional square foot in home size. Round your answers to three decimal places and enter in increasing order.arrow_forwardConsider the following computer output from a multiple regression analysis relating the cost of car insurance to the variables: number of car accidents, driver's credit score, and safety rating of the car. Intercept Car Accidents (In last 3 years) Credit Score Safety Rating Answer Coefficients 933 167.94 - 102.63 -199.18 Does the sign of the coefficient for the variable credit score make sense? Coefficients Standard Error 95.65 17.99 10.89 19.98 t Stat P-value 9.754 0.0000 9.335 0.0000 -9.424 0.0000 -9.969 0.0000 O Yes, because it is expected that as the credit score increases then the cost should decrease. O No, because it is expected that as the credit score increases then the cost should decrease. O Yes, because it is expected that as the credit score increases then the cost should also increase. O No, because it is expected that as the credit score increases then the cost should also increase. Tables Keypad Keyboard Shortcutsarrow_forward
- Listed below are systolic blood pressure measurements (in mm Hg) obtained from the same woman. Find the regression equation, letting the right arm blood pressure be the predictor (x) variable. Find the best predicted systolic blood pressure in the left arm given that the systolic blood pressure in the right arm is 80 mm Hg. Use a significance level of 0.05. Right Arm 100 99 93 77 77 Q Left Arm 174 168 148 148 146 Click the icon to view the critical values of the Pearson correlation coefficient r The regression equation is ŷ=+x. (Round to one decimal place as needed.) mm Hg. Given that the systolic blood pressure in the right arm is 80 mm Hg, the best predicted systolic blood pressure in the left arm is (Round to one decimal place as needed.) Data table Critical Values of the Pearson Correlation Coefficient r α = 0.05 α = 0.01 0.950 0.990 0.959 0.878 0.811 0.917 0.754 0.875 0.707 0.834 0.666 0.798 0.632 0.765 0.602 0.735 0.576 0.708 0.553 0.684 0.532 0.661 0.514 0.641 0.497 0.623 0.482…arrow_forwardLet's study the relationship between brand, camera resolution, and internal storage capacity on the price of smartphones. Use α = .05 to perform a regression analysis of the Smartphones01CS dataset, and then answer the following questions. When you copy and paste output from MegaStat to answer a question, remember to choose to "Keep Formatting" to paste the text. a. Did you find any evidence of multicollinearity and variance inflation among the predictors. Explain your answer using a VIF analysis. b. Copy and paste the normal probability plot for your analysis. Is there any evidence that the errors are not normally distributed? Explain. c. Copy and paste the Residuals vs. Predicted Y-values. Does the pattern support the null hypothesis of constant variance for the errors? Explain. d. Study the residuals analysis. Which observations, if any, have unusual residuals? e. Study the residuals analysis. Calculate the leverage statistic. Which observations, if any, are high leverage…arrow_forwardConsider the following computer output from a multiple regression analysis relating the cost of car insurance to the variables: number of car accidents, driver's credit score, and safety rating of the car. Coefficients Coefficients Standard Error t Stat P-value Intercept 956 97.23 9.832 0.0000 Car Accidents 172.08 18.24 9.434 0.0000 (In last 3 years) Credit Score Safety Rating 105.16 201.03 0.523 0.6030 -207.81 20.46 - 10.157 0.0000 Does the sign of the coefficient for the variable credit score make sense? Answer No, because it is expected that as the credit score increases then the cost should decrease. ○ No, because it is expected that as the credit score increases then the cost should also increase. ○ Yes, because it is expected that as the credit score increases then the cost should decrease. ○ Yes, because it is expected that as the credit score increases then the cost should also increase. Tables Keypad Keyboard Shortcutsarrow_forward
arrow_back_ios
arrow_forward_ios
Recommended textbooks for you
- MATLAB: An Introduction with ApplicationsStatisticsISBN:9781119256830Author:Amos GilatPublisher:John Wiley & Sons Inc
 Probability and Statistics for Engineering and th...StatisticsISBN:9781305251809Author:Jay L. DevorePublisher:Cengage Learning
 Statistics for The Behavioral Sciences (MindTap C...StatisticsISBN:9781305504912Author:Frederick J Gravetter, Larry B. WallnauPublisher:Cengage Learning
  Elementary Statistics: Picturing the World (7th E...StatisticsISBN:9780134683416Author:Ron Larson, Betsy FarberPublisher:PEARSON
 The Basic Practice of StatisticsStatisticsISBN:9781319042578Author:David S. Moore, William I. Notz, Michael A. FlignerPublisher:W. H. Freeman
 Introduction to the Practice of StatisticsStatisticsISBN:9781319013387Author:David S. Moore, George P. McCabe, Bruce A. CraigPublisher:W. H. Freeman
MATLAB: An Introduction with Applications
Statistics
ISBN:9781119256830
Author:Amos Gilat
Publisher:John Wiley & Sons Inc
Probability and Statistics for Engineering and th...
Statistics
ISBN:9781305251809
Author:Jay L. Devore
Publisher:Cengage Learning
Statistics for The Behavioral Sciences (MindTap C...
Statistics
ISBN:9781305504912
Author:Frederick J Gravetter, Larry B. Wallnau
Publisher:Cengage Learning
Elementary Statistics: Picturing the World (7th E...
Statistics
ISBN:9780134683416
Author:Ron Larson, Betsy Farber
Publisher:PEARSON
The Basic Practice of Statistics
Statistics
ISBN:9781319042578
Author:David S. Moore, William I. Notz, Michael A. Fligner
Publisher:W. H. Freeman
Introduction to the Practice of Statistics
Statistics
ISBN:9781319013387
Author:David S. Moore, George P. McCabe, Bruce A. Craig
Publisher:W. H. Freeman