
Practical Management Science
6th Edition
ISBN: 9781337406659
Author: WINSTON, Wayne L.
Publisher: Cengage,
expand_more
expand_more
format_list_bulleted
Related questions
Concept explainers
Question
Consider the time series data in Table 4
- Construct a time series plot. What type of pattern exists in the data?
- Develop a three-week moving average for this time series. Compute MSE and a
forecast for week 8. - Use α = 0.2 to compute the exponential smoothing value for the time series. Compute MSE and a forecast for week 8.
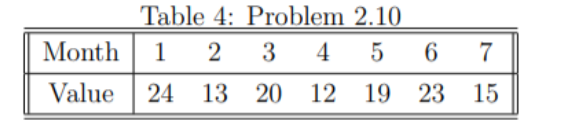

Transcribed Image Text:Table 4: Problem 2.10
3 4
Month
1
6
Value
24 13 20
12
19 23 15
Expert Solution
This question has been solved!
Explore an expertly crafted, step-by-step solution for a thorough understanding of key concepts.

This is a popular solution

Trending nowThis is a popular solution!

Step by stepSolved in 4 steps with 1 images

Knowledge Booster


Learn more about
Need a deep-dive on the concept behind this application? Look no further. Learn more about this topic, operations-management and related others by exploring similar questions and additional content below.Similar questions
- If month one has 240,000 demands, month two 250,080 demands, month three 325,00 demands, month four 370,000 demands, month five 420,000 demands and month six 509,00 demands. Use a forecast for the first month of 240,000, an initial trend forecast of 50,000, and smoothing parameters of 0.35 for both demand smoothing and trend smoothing. Compute the forecasts and trends using double exponential smoothingarrow_forwardUse exponential smoothing with trend adjustment to forecast deliveries for period 5. Let α = 0.1, β = 0.2, and let the initial trend value be 4 and the initial forecast be 200 (both are given in the table). (a) Complete the table below and to predict the demand for Period 5 (See image). Show the calculations for the demand for Period 2. (b) Based on the actual demands of the first 4 periods forecast the demand for period 5 using the linear regression method. (c) Which method performs better based on the actual demand for period 5? Why do you think so?arrow_forwardThe following table gives the number of pints of type A blood used at Damascus Hospital in the past 6 weeks: Week of Pints used Aug 31 360 Sep 7 370 Sep 14 412 Sep 21 383 Sep 28 371 Oct 5 371 A) The forecasted demand for the week of October 12 using a 3-week moving average = 375 B) Using the 3-week weighted moving average, with weights of 0.10, 0.35, 0.55, using 0,55 for the most recent week, the forecasted demand for the week of October 12=[__] pints (round your response to two decimal places and remember to use the weights in appropriate order- the largest weight applies to most recent period and smallest weight applies to oldest period.)arrow_forward
- The purpose of this assignment is to give you an opportunity to create a forecast based on data and interpret the results. You will also gain more practice with Minitab. Forecasting future commodity prices can be important for many production operations. One such commodity is the price of aluminum ($US per metric ton). For this assignment, you are asked to use Minitab to create two forecasts based upon the data provided below. First, create a one period forecast based upon a three month moving average. Second, create a one period forecast based upon exponential smoothing (using a smoothing weight of 0.95). Compare the two forecasts based upon the Mean Absolute Deviation (MAD) measure of accuracy. Interpret your results. The Data: Month Price Jan-18 2,209.73 Feb-18 2,181.79 Mar-18 2,069.24 Apr-18 2,254.69 May-18 2,299.67 Jun-18 2,237.62 Jul-18 2,082.24 Aug-18 2,051.51 Sep-18 2,026.46 Oct-18 2,029.86 Nov-18 1,938.51 Dec-18 1,920.38 Jan-19 1,853.72 Feb-19…arrow_forwardMark Gershon, owner of a musical instrument distributorship, thinks that demand for guitars may be related to the number of television appearances by the popular group Maroon 5 during the previous month. Gershon has collected the data shown in the following table: Maroon 5 TV Appearances 3 4 8 6 7 7 Demand for Guitars 4 6 7 5 10 6 This exercise contains only parts b, c, and d. Part 2 b) Using the least-squares regression method, the equation for forecasting is (round your responses to four decimal places): Y = enter your response here + enter your response herexarrow_forwardDevelop a forecast for the next month using a four-month moving average method. Use the Excel Functions SLOPE and INTERCEPT to write the linear regression prediction equation with Months as the independent variable and sales as the dependent variable. Use the prediction equation to estimate the number of sales in month 9.arrow_forward
- Elna inc is a microwave manufacturing and distribution company based in Jakarta. The company needs to estimate production demand using the historical sales data of the last 24 months (periods).A logistics manager of the company then uses the moving average, exponential smoothing, and simple linear regression methods to determine sales forecasts for the next 12 months (Graphically illustrate the results). Provide an analysis and the results of bias, MAPE, MSE, and MAD for the forecasting decisions.Moving average is 4 month, and alfa is 0.05arrow_forwardY9arrow_forwardA company wants to generate a forecast for unit demand for year 2017 using exponential smoothing. The actual demand in year 2016 was 120. The forecast demand in year 2016 was 110. Using this data and a smoothing constant alpha of 0.1, which of the following is the resulting year 2017 forecast value?arrow_forward
- Harlen Industries has a simple forecasting model: Take the actual demand for the same month last year and divide that by the number of fractional weeks in that month. This gives the average weekly demand for that month. This weekly average is used as the weekly forecast for the same month this year. This technique was used to forecast eight weeks for this year, which are shown in the following tables along with the actual demand that occurred. The following eight weeks show the forecast (based on last year) and the demand that actually occurred (picture attached): Calculate the MAD and tracking signal for each week.arrow_forwardThe problem below looks at forecasting methodologies to determine which forecasting model results in the most accurate forecasts. Accuracy is determined by the lowest mean absolute deviation. Emergency calls to the 911 system of York County for the past 24 weeks are shown below. Accurate forecasts are needed to determine the number of operators needed to staff the station. Week # of Calls 1 50 2 35 3 25 4 40 5 45 6 35 7 20 8 30 9 35 10 20 11 15 12 40 13 55 14 35 15 25 16 55 17 55 18 40 19 35 20 60 21 75 22 50 23 40 24 65 1. WEIGHTED MOVING AVERAGE Using an averaging period of 3 with the most recent period weighted .5, the next most recent .4, and the oldest period weighted .1, forecast weeks 4 through 24. Calculate the MAD for this forecasting model. Show your work in a table like the one below Indicate which model is…arrow_forwardPlease do not give solution in image formate thanku. The Willow River Mining Company mines and ships coal. It has experienced the following demand for coal during the past eight years: Year Coal Sales (tonnes) 1 4260 2 4510 3 4050 4 3720 5 3900 6 3470 7 2890 8 3100 Develop an adjusted exponential smoothing model (α=0.30, β=0.20) and a linear trend line model, and compare the forecast accuracy of the two using MAD. Indicate which forecast seems to be most accurate.arrow_forward
arrow_back_ios
arrow_forward_ios
Recommended textbooks for you
- Practical Management ScienceOperations ManagementISBN:9781337406659Author:WINSTON, Wayne L.Publisher:Cengage,
 Operations ManagementOperations ManagementISBN:9781259667473Author:William J StevensonPublisher:McGraw-Hill Education
 Operations and Supply Chain Management (Mcgraw-hi...Operations ManagementISBN:9781259666100Author:F. Robert Jacobs, Richard B ChasePublisher:McGraw-Hill Education
 Purchasing and Supply Chain ManagementOperations ManagementISBN:9781285869681Author:Robert M. Monczka, Robert B. Handfield, Larry C. Giunipero, James L. PattersonPublisher:Cengage Learning
 Production and Operations Analysis, Seventh Editi...Operations ManagementISBN:9781478623069Author:Steven Nahmias, Tava Lennon OlsenPublisher:Waveland Press, Inc.
Practical Management Science
Operations Management
ISBN:9781337406659
Author:WINSTON, Wayne L.
Publisher:Cengage,
Operations Management
Operations Management
ISBN:9781259667473
Author:William J Stevenson
Publisher:McGraw-Hill Education
Operations and Supply Chain Management (Mcgraw-hi...
Operations Management
ISBN:9781259666100
Author:F. Robert Jacobs, Richard B Chase
Publisher:McGraw-Hill Education
Purchasing and Supply Chain Management
Operations Management
ISBN:9781285869681
Author:Robert M. Monczka, Robert B. Handfield, Larry C. Giunipero, James L. Patterson
Publisher:Cengage Learning
Production and Operations Analysis, Seventh Editi...
Operations Management
ISBN:9781478623069
Author:Steven Nahmias, Tava Lennon Olsen
Publisher:Waveland Press, Inc.