Determination of the concentration of Zn(II) in a sample of river water was carried out by the standard addition method. A standard solution of 20 ppm Zn(II) was prepared and added to the filtered river water sample. The prepared series of solutions were then measured for absorbance with AAS and the results were as follows: 1. Fe(lII) 20 ppm (ml) | Sample (ml) 0,0 H2O (ml) A 0.111 1 9. 0,2 1 8 0.167 0,4 1 7 0.223 0,6 1 6 0.286 0,8 1,0 1 5 0.347 1 4 0.401 a. Draw a calibration curve for the volume of Zn(1I) vs. absorbance and concentration i Zn(11) vs. absorbance b. Based on the available data, what is the concentration of Zn(lI) in the sample
Determination of the concentration of Zn(II) in a sample of river water was carried out by the standard addition method. A standard solution of 20 ppm Zn(II) was prepared and added to the filtered river water sample. The prepared series of solutions were then measured for absorbance with AAS and the results were as follows: 1. Fe(lII) 20 ppm (ml) | Sample (ml) 0,0 H2O (ml) A 0.111 1 9. 0,2 1 8 0.167 0,4 1 7 0.223 0,6 1 6 0.286 0,8 1,0 1 5 0.347 1 4 0.401 a. Draw a calibration curve for the volume of Zn(1I) vs. absorbance and concentration i Zn(11) vs. absorbance b. Based on the available data, what is the concentration of Zn(lI) in the sample

Principles of Instrumental Analysis
7th Edition
ISBN:9781305577213
Author:Douglas A. Skoog, F. James Holler, Stanley R. Crouch
Publisher:Douglas A. Skoog, F. James Holler, Stanley R. Crouch
Chapter9: Atomic Absorption And Atomic Fluorescence Spectrometry
Section: Chapter Questions
Problem 9.7QAP

Related questions
Question
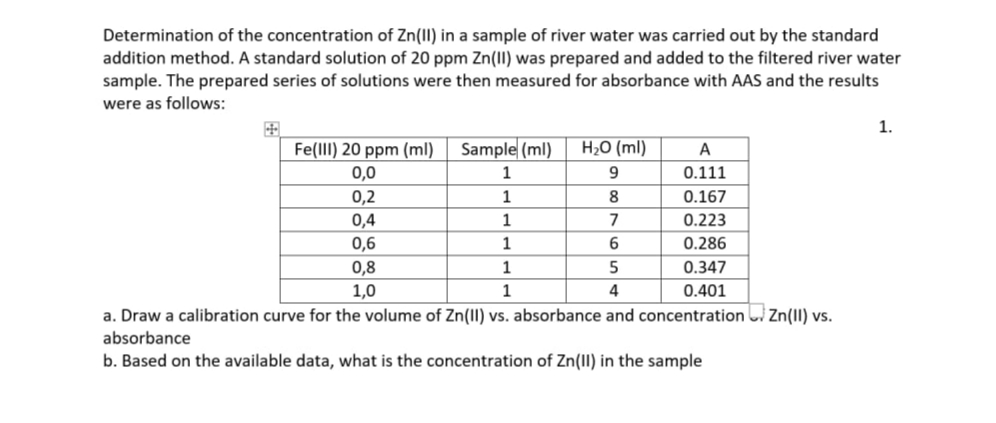
Transcribed Image Text:Determination of the concentration of Zn(II) in a sample of river water was carried out by the standard
addition method. A standard solution of 20 ppm Zn(II) was prepared and added to the filtered river water
sample. The prepared series of solutions were then measured for absorbance with AAS and the results
were as follows:
1.
Fe(lII) 20 ppm (ml) Sample (ml)
H2O (ml)
A
0,0
1
0.111
0,2
1
8
0.167
0,4
7
0.223
0,6
1
6.
0.286
0,8
1
0.347
1,0
1
0.401
a. Draw a calibration curve for the volume of Zn(II) vs. absorbance and concentration Zn(II) vs.
absorbance
b. Based on the available data, what is the concentration of Zn(II) in the sample
Expert Solution
This question has been solved!
Explore an expertly crafted, step-by-step solution for a thorough understanding of key concepts.

This is a popular solution!

Trending now
This is a popular solution!

Step by step
Solved in 6 steps with 6 images

Recommended textbooks for you
Principles of Instrumental Analysis
Chemistry
ISBN:
9781305577213
Author:
Douglas A. Skoog, F. James Holler, Stanley R. Crouch
Publisher:
Cengage Learning
Principles of Instrumental Analysis
Chemistry
ISBN:
9781305577213
Author:
Douglas A. Skoog, F. James Holler, Stanley R. Crouch
Publisher:
Cengage Learning