Figure 3 16 Mean 14 level 12 of expres 10 sion strain 17 strain 22 17 (arbitr ary units) 31 28 11 21 Amount of recombinant DNA introduced Figure 3. Two engineered E. coli strains were made such that different variations of each strain had different numbers/amounts of recombinant DNA introduced for genes involved in Taxadiene synthesis (a precursor for Taxol). These strains were grown and then the amount of. a protein product in the Taxadiene pathway was measured. The data points are the mean values of protein product expression +/- standard deviation from four replicates 1. For the graph: a) Describe the graph: b) Describe the data: c) Interpret the data: Describe the statistics that are shown and what you can infer from them. Are there other statistics that would be better suited for this data? Is there any flaw in the way the data is represented?
Figure 3 16 Mean 14 level 12 of expres 10 sion strain 17 strain 22 17 (arbitr ary units) 31 28 11 21 Amount of recombinant DNA introduced Figure 3. Two engineered E. coli strains were made such that different variations of each strain had different numbers/amounts of recombinant DNA introduced for genes involved in Taxadiene synthesis (a precursor for Taxol). These strains were grown and then the amount of. a protein product in the Taxadiene pathway was measured. The data points are the mean values of protein product expression +/- standard deviation from four replicates 1. For the graph: a) Describe the graph: b) Describe the data: c) Interpret the data: Describe the statistics that are shown and what you can infer from them. Are there other statistics that would be better suited for this data? Is there any flaw in the way the data is represented?

Human Anatomy & Physiology (11th Edition)
11th Edition
ISBN:9780134580999
Author:Elaine N. Marieb, Katja N. Hoehn
Publisher:Elaine N. Marieb, Katja N. Hoehn
Chapter1: The Human Body: An Orientation
Section: Chapter Questions
Problem 1RQ: The correct sequence of levels forming the structural hierarchy is A. (a) organ, organ system,...

Related questions

Concept explainers
Question
For the graph:
a) Describe the graph:
b) Describe the data:
c) Interpret the data: Describe the statistics that are shown and what you can infer from them.
Transcribed Image Text:Cla
Week12_Activity - Microsoft Word
Home
Insert
Page Layout
References
Mailings
Review
View
% Cut
A Find -
- 12
-A A
幸 T
Aal
Arial
AaBbCc AaBbCc AaBbCc AaBbCc AaB AaBbCcl AaBbCc AaBbCc AaBbC AaBbCc AaBbCc
A Copy
a Replace
Paste
B I U
U -
abe x, x Aa
ab -
A
个三。
I Normal
T No Spaci. Heading 1 Heading 2
Title
Change
Subtitle
Subtle Em. Emphasis Intense E.
Strong
Quote
Format Painter
Styles - Select -
Clipboard
Paragraph
Editing
Font
Styles
Figure 3
16
Mean
14
level
of
12
expres 10
sion
strain 17
strain 22
17
8.
(arbitr
6.
32
ary
units)
31
4
28
30
29 25
2
27
2
6
11
21
Amount of recombinant
DNA introduced
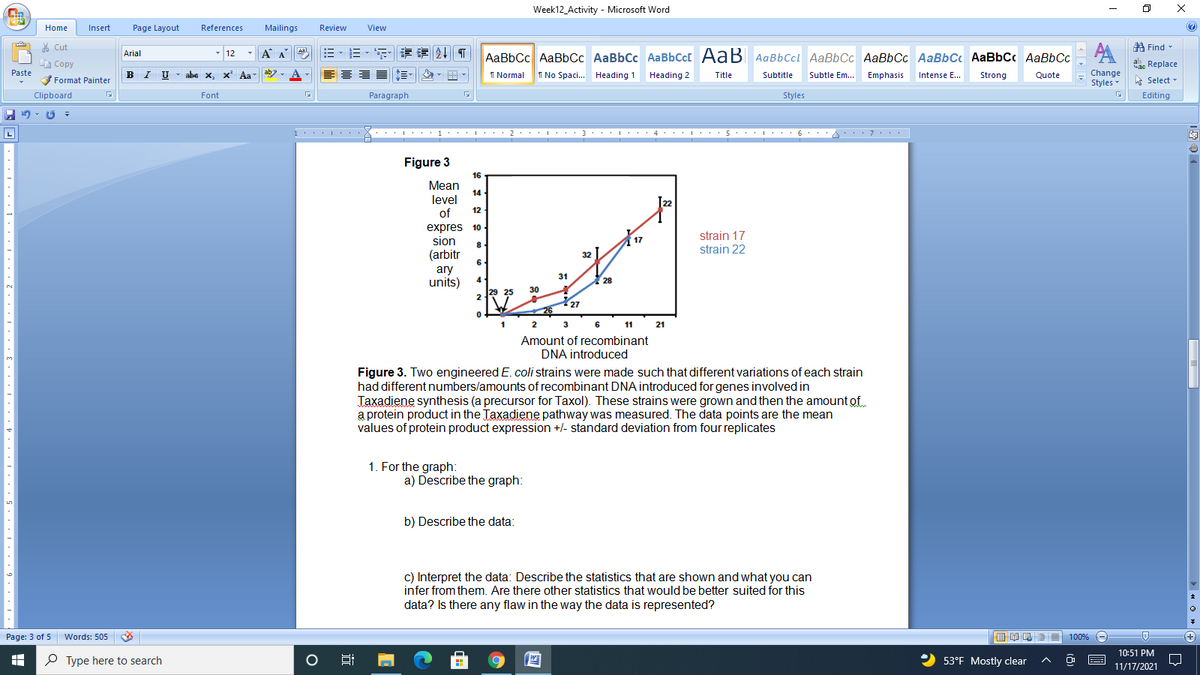
Figure 3. Two engineered E. coli strains were made such that different variations of each strain
had different numbers/amounts of recombinant DNA introduced for genes involved in
Jaxadiene synthesis (a precursor for Taxol). These strains were grown and then the amount of
a protein product in the Taxadiene pathway was measured. The data points are the mean
values of protein product expression +/- standard deviation from four replicates
1. For the graph:
a) Describe the graph:
b) Describe the data:
c) Interpret the data: Describe the statistics that are shown and what you can
infer from them. Are there other statistics that would be better suited for this
data? Is there any flaw in the way the data is represented?
Page: 3 of 5 Words: 505
目 島
100% -
10:51 PM
P Type here to search
2 53°F Mostly clear
E
11/17/2021
Expert Solution
This question has been solved!
Explore an expertly crafted, step-by-step solution for a thorough understanding of key concepts.

Step by step
Solved in 2 steps

Knowledge Booster


Learn more about
Need a deep-dive on the concept behind this application? Look no further. Learn more about this topic, biology and related others by exploring similar questions and additional content below.Recommended textbooks for you
Human Anatomy & Physiology (11th Edition)
Biology
ISBN:
9780134580999
Author:
Elaine N. Marieb, Katja N. Hoehn
Publisher:
PEARSON

Biology 2e
Biology
ISBN:
9781947172517
Author:
Matthew Douglas, Jung Choi, Mary Ann Clark
Publisher:
OpenStax

Anatomy & Physiology
Biology
ISBN:
9781259398629
Author:
McKinley, Michael P., O'loughlin, Valerie Dean, Bidle, Theresa Stouter
Publisher:
Mcgraw Hill Education,
Human Anatomy & Physiology (11th Edition)
Biology
ISBN:
9780134580999
Author:
Elaine N. Marieb, Katja N. Hoehn
Publisher:
PEARSON
Biology 2e
Biology
ISBN:
9781947172517
Author:
Matthew Douglas, Jung Choi, Mary Ann Clark
Publisher:
OpenStax
Anatomy & Physiology
Biology
ISBN:
9781259398629
Author:
McKinley, Michael P., O'loughlin, Valerie Dean, Bidle, Theresa Stouter
Publisher:
Mcgraw Hill Education,

Molecular Biology of the Cell (Sixth Edition)
Biology
ISBN:
9780815344322
Author:
Bruce Alberts, Alexander D. Johnson, Julian Lewis, David Morgan, Martin Raff, Keith Roberts, Peter Walter
Publisher:
W. W. Norton & Company

Laboratory Manual For Human Anatomy & Physiology
Biology
ISBN:
9781260159363
Author:
Martin, Terry R., Prentice-craver, Cynthia
Publisher:
McGraw-Hill Publishing Co.

Inquiry Into Life (16th Edition)
Biology
ISBN:
9781260231700
Author:
Sylvia S. Mader, Michael Windelspecht
Publisher:
McGraw Hill Education