If the federal tax system was changed to a proportional tax rate structure with a tax rate of 17%, calculate the amount of tax liability for 2018 for all taxpayers. How does this amount differ from the actual liability?
If the federal tax system was changed to a proportional tax rate structure with a tax rate of 17%, calculate the amount of tax liability for 2018 for all taxpayers. How does this amount differ from the actual liability?

Cornerstones of Financial Accounting
4th Edition
ISBN:9781337690881
Author:Jay Rich, Jeff Jones
Publisher:Jay Rich, Jeff Jones
Chapter8: Current And Contingent Liabilities
Section: Chapter Questions
Problem 42BE: Accrued Income Taxes Nolan Inc. had taxable income of $400,000 in 2019. Its effective tax rate is...

Related questions
Question
Use the information in Table 1-3. If the federal tax system was changed to a proportional tax rate structure with a tax rate of 17%, calculate the amount of tax liability for 2018 for all taxpayers. How does this amount differ from the actual liability?
Graded on the following: Calculates tax liability for yearly taxpayers indicating how amounts differ from the actual liability.
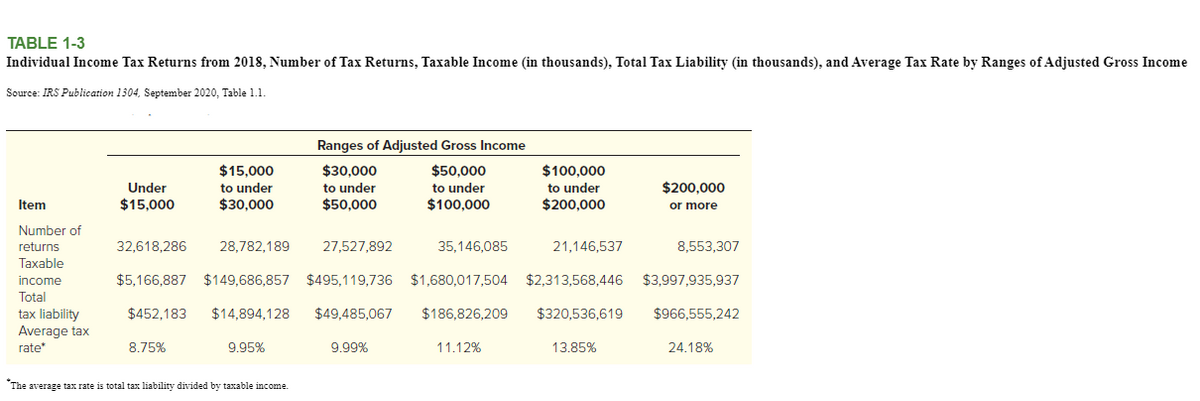
Transcribed Image Text:TABLE 1-3
Individual Income Tax Returns from 2018, Number of Tax Returns, Taxable Income (in thousands), Total Tax Liability (in thousands), and Average Tax Rate by Ranges of Adjusted Gross Income
Source: IRS Publication 1304, September 2020, Table 1.1
Ranges of Adjusted Gross Income
$15,000
$30,000
$50,000
$100,000
to under
$200,000
Under
to under
to under
to under
$200,000
Item
$15,000
$30,000
$50,000
$100,000
or more
Number of
returns
Taxable
32,618,286
28,782,189
27,527,892
35,146,085
21,146,537
8,553,307
income
$5,166,887 $149,686,857 $495,119,736
$1,680,017,504
$2,313,568,446
$3,997,935,937
Total
$966,555,242
tax liability
Average tax
rate
$452.183
$14,894,128
$49,485,067
$186,826,209
$320,536,619
8.75%
9.95%
9.99%
11.12%
13.85%
24.18%
The average tax rate is total tax liability divided by taxable income.
Expert Solution
This question has been solved!
Explore an expertly crafted, step-by-step solution for a thorough understanding of key concepts.

This is a popular solution!

Trending now
This is a popular solution!

Step by step
Solved in 2 steps

Recommended textbooks for you
Cornerstones of Financial Accounting
Accounting
ISBN:
9781337690881
Author:
Jay Rich, Jeff Jones
Publisher:
Cengage Learning

Intermediate Accounting: Reporting And Analysis
Accounting
ISBN:
9781337788281
Author:
James M. Wahlen, Jefferson P. Jones, Donald Pagach
Publisher:
Cengage Learning

Cornerstones of Financial Accounting
Accounting
ISBN:
9781337690881
Author:
Jay Rich, Jeff Jones
Publisher:
Cengage Learning
Intermediate Accounting: Reporting And Analysis
Accounting
ISBN:
9781337788281
Author:
James M. Wahlen, Jefferson P. Jones, Donald Pagach
Publisher:
Cengage Learning

Financial Accounting: The Impact on Decision Make…
Accounting
ISBN:
9781305654174
Author:
Gary A. Porter, Curtis L. Norton
Publisher:
Cengage Learning
Individual Income Taxes
Accounting
ISBN:
9780357109731
Author:
Hoffman
Publisher:
CENGAGE LEARNING - CONSIGNMENT
