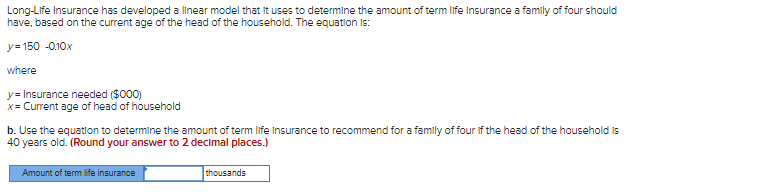
Long-Life Insurance has developed a linear model that it uses to determine the amount of term life Insurance a family of four should have, based on the current age of the head of the household. The equation is: y=150 -0.10x where y= Insurance needed ($000) x= Current age of head of household b. Use the equation to determine the amount of term life Insurance to recommend for a family of four of the head of the household is 40 years old. (Round your answer to 2 decimal places.) Amount of term life insurance thousands


Q: Using the Decision Tree above, determine the Expected Value with Sample Information (EV with SI).…
A: Expected values are calculated by multiplying the probability of an event occurring with the value…
Q: a. Calculate ALL the missing (?) data points. b. Draw the PERT network from the given data.…
A: As per Bartleby guidelines, we can only solve the first three subparts of one question at a…
Q: Write brief notes on purchasing mix and management of Inventory
A: Purchasing mix = Purchasing mix provides the list of factors which impact the purchasing decision…
Q: Find the assignment which minimizes total cost of the project. Each contractor has to be assigned…
A: An assignment problem is a technique to find the combinations of the optimal solution to the…
Q: (d) Identify each of the right-hand-side ranges. (Round your answers to two decimal places. If there…
A: Linear programming is a mathematical technique that is also used in operations management…
Q: Consider the following LP problem: Maximum utility: 8x + 9y 4x + 3y 0 1. What is the optimal…
A: Given data is Objective function: Max Z=8x+9y Subject to constraints: 1.) 4x+3y<1502.)…
Q: [item no.14] A company uses the production run model to determine the number of t-shirts that must…
A: Inventory management is described as the process or means through which the inventory produced by a…
Q: Provide the difference between Slack time and Cycle-time efficiency. There are how many ways to…
A: Difference between Slack time and Cycle-time efficiency Slack time Slack time is really a…
Q: Suppose Jack like to solve the following formulation in Excel. And the problem is setup in…
A: Formulate a spreadsheet for the given LP as shown in the following steps:
Q: A business wants to decide whether to launch a new product. If the product is launched there are two…
A: Decision tree helps in taking the right decision which can reduce costs and increase profits.
Q: Is James' plan ethical?
A: Any data manipulation is regarded as a fraudulent act. The idea of transferring some of the…
Q: Which one is a typical social/economic benefit for transport infrastructure development plans?…
A: The transport infrastructure comprises ports, airports, road and rail networks, depots, pipeline…
Q: Understanding the distinctions between project management and software project management is…
A: Project Management: Project management is the process of application of collection of tools and…
Q: Dave's latest start (LS) and latest finish (LF) are: Activity H LS 13 LF
A: Steps to find LS and LF: Start from the end and take LF same as EF of the ending activity, that is,…
Q: What effect do processes like expert judgment, data analysis, and meetings have on the ultimate…
A: Definitions: Expert judgment: - Expert judgment refers to the opinion or suggestion of a person who…
Q: We do a business model study because... How do we perceive our business solution? Will this provide…
A: The business solution can be defined according to -: customer outcomes what is the particular…
Q: Determine the expected value of the contribution
A: The expected value of a decision tree is the sum of the expected values of all the nodes.
Q: Thanks for the answer, but what is the simplest way of calculating and drawing the PERT network…
A: A network diagram related to the project shows the sequence of the task that is performed to…
Q: Innis Investments manages funds for a number of companies and wealthy clients. The investment…
A: The following computer solution (Sensitivity report) is provided for the question:
Q: s defined as that complex wholewhich includes knowledge, beliefs, arts, morals, law, customs, and…
A: A man in a society acquires knowledge, beliefs, art, morals and customs from its culture. Morality…
Q: Why is it so effective if the benefit of portfolio analysis is that it prompts you to consider…
A: introduction: Investors do a portfolio analysis to assess the efficacy and security of a portfolio.…
Q: III. Productivity and Quality. Read and analyze each problem. For better presentation, draw diagrams…
A:
Q: Evaluate the impact of the container shortage
A: The supply chain logjam in the form of shipping container scarcity & escalating trade costs are…
Q: mental models have on the decision-making process
A: You can grasp life by using mental models. One mental model that can help you comprehend how the…
Q: What is a supply chain? In your view, why did supply chains become global?
A: Operation management often called OM can be stated as the governance of the business practices to…
Q: Solve the following LP by using Excel. State the Optimal Solution and the Objective Function Value.…
A: Linear programming is a mathematical technique that is commonly used in operations management…
Q: Assume that a computer has two 1TB disks, D0 and D1. The Mean Time to Failure (MTTF) of each disk is…
A:
Q: A caterer prepares 2,000 meals for a client’ company event consuming the following resources: Labor…
A: Total output (O)= 2000 meal Number of working hour (N)= 6 hr Calculate Labor productivity Labor…
Q: What is the total crashing cost? $ week(s) (Enter your response as a whole number.)
A:
Q: A group is planning to back the production of a new musical at Lusaka Playhouse. It would cost K100…
A: One can calculate the expected value for a decision tree by multiplying each node's probability and…
Q: The following monthly sales of chocolate boxes (in thousands of AUS dollars) have been recorded for…
A: Naive Method: Using the prior observation as the forecast without making any changes is known as a…
Q: risks do building a public security infrastructure entail
A: Enterprises can employ 3rd -party cloud service providers to manage applications & to manage…
Q: What are ten (10) roles of the project manager
A: Professionals that lead teams during the planning, initiation, and completion phases of a business…
Q: Roger Ginde is developing a program in supply chain management certification for managers. Ginde has…
A: A resource-utilization approach called the Critical path method (CPM) is used to schedule a group of…
Q: You work for the Brad's Nailer Company which manufactures two types of nailers: a pneumatic model…
A: Let 'P' be pneumatic nailers to be produced, and let 'C' be the cordless nailers to be produced. Min…
Q: Provide a quick example to explain the difference between risk segmentation and stratification.
A: Risk management can be stated as the approach of recognizing, evaluating, and handling or…
Q: Product X currently sells for $12 per unit. The variable costs is $4 per unit and 10,000 units are…
A: Variable Cost is given as $4 per unit Sales =Number of units sold × Per unit price =10000…
Q: Critically discuss early project termination within a project organisation.
A: Within a project organization, both the project team and the stakeholders making the decision find…
Q: Tyler Apiaries sells bees and beekeeping supplies. Bees (including a queen) are shipped in special…
A: given that: average 1.4 std.deviation 0.16 USL 1.8 LSL 1.2
Q: How can you measure productivity in a service-based business firm/enterprise?
A: Productivity is the ratio of output to input.
Q: Draw a decision tree and advise which course of action generates the greatest expected profit. ii.…
A: The expected value can be calculated using a decision tree, which will show all the possible…
Q: The probabilities associate with the states of nature are 0.3 for S, 0.45 for M, an 0.25 for G. a.…
A: Mathematic models of decision-making help businesses take the correct decision for their operational…
Q: PharmaPlus operates a chain of 30 pharmacies. The pharmacies are staffed by licensed pharmacists and…
A: Given data is Current no. of pharmacists = 85 Current no. of technicians = 175 Required employees =…
Q: Why, if you were the project manager, would you utilize collaborative software?
A: Collaborative software can be stated as the software that is generally designed to increment the…
Q: A foundry receives an order for four custom-designed castings. The customer will pay $30,000 for…
A:
Q: How is the organisation of Sizanani Community funded?
A: Sizanani's response to the community's concerns for OVC is thorough. The program aims to provide…
Q: An engineering plant has developed the accompanying supply, demand, cost and inventory data. The…
A: Find the given details below: Given details: Period 1 2 3 Demand 650 700 900 Regular time…
Q: You look over the reports from the last 24 hours of your production line. You see the following:…
A: OEE (Overall Equipment Effectiveness) refers to the technique to measure the production process…
Q: Activity Event Immediate 1 2 3 14 5 |6 17 8 development of a new product in your organization. 19 10…
A: Total expected time = (optimistic time +4*most likely time + pessimistic time)/ 6
Q: A local distributor for a national tire company expects to sell approximately 200 steel-belted…
A: Given data Annual demand (D)= 200 units Annual carrying cost (H)= $20 per tire Ordering cost (S)…


Trending now
This is a popular solution!

Step by step
Solved in 2 steps

Long-Life Insurance developed a linear model to determine the amount of term life insurance a family of four should have, based on the head of the household's current age.
The equation is: y = 163 -0.45x
where
y = Insurance needed ($000)
x = Current age of head of household
Calculate the amount of term life insurance you would recommend for a family of four if the head of the household is 53 years old. (Round your answer to 2 decimal places.)
- An automobile manufacturer is considering whether to introduce a new model called the Racer. The profitability of the Racer depends on the following factors: The fixed cost of developing the Racer is triangularly distributed with parameters 3, 4, and 5, all in billions. Year 1 sales are normally distributed with mean 200,000 and standard deviation 50,000. Year 2 sales are normally distributed with mean equal to actual year 1 sales and standard deviation 50,000. Year 3 sales are normally distributed with mean equal to actual year 2 sales and standard deviation 50,000. The selling price in year 1 is 25,000. The year 2 selling price will be 1.05[year 1 price + 50 (% diff1)] where % diff1 is the number of percentage points by which actual year 1 sales differ from expected year 1 sales. The 1.05 factor accounts for inflation. For example, if the year 1 sales figure is 180,000, which is 10 percentage points below the expected year 1 sales, then the year 2 price will be 1.05[25,000 + 50( 10)] = 25,725. Similarly, the year 3 price will be 1.05[year 2 price + 50(% diff2)] where % diff2 is the percentage by which actual year 2 sales differ from expected year 2 sales. The variable cost in year 1 is triangularly distributed with parameters 10,000, 12,000, and 15,000, and it is assumed to increase by 5% each year. Your goal is to estimate the NPV of the new car during its first three years. Assume that the company is able to produce exactly as many cars as it can sell. Also, assume that cash flows are discounted at 10%. Simulate 1000 trials to estimate the mean and standard deviation of the NPV for the first three years of sales. Also, determine an interval such that you are 95% certain that the NPV of the Racer during its first three years of operation will be within this interval.It costs a pharmaceutical company 75,000 to produce a 1000-pound batch of a drug. The average yield from a batch is unknown but the best case is 90% yield (that is, 900 pounds of good drug will be produced), the most likely case is 85% yield, and the worst case is 70% yield. The annual demand for the drug is unknown, with the best case being 20,000 pounds, the most likely case 17,500 pounds, and the worst case 10,000 pounds. The drug sells for 125 per pound and leftover amounts of the drug can be sold for 30 per pound. To maximize annual expected profit, how many batches of the drug should the company produce? You can assume that it will produce the batches only once, before demand for the drug is known.A company manufacturers a product in the United States and sells it in England. The unit cost of manufacturing is 50. The current exchange rate (dollars per pound) is 1.221. The demand function, which indicates how many units the company can sell in England as a function of price (in pounds) is of the power type, with constant 27556759 and exponent 2.4. a. Develop a model for the companys profit (in dollars) as a function of the price it charges (in pounds). Then use a data table to find the profit-maximizing price to the nearest pound. b. If the exchange rate varies from its current value, does the profit-maximizing price increase or decrease? Does the maximum profit increase or decrease?
- The eTech Company is a fairly recent entry in the electronic device area. The company competes with Apple. Samsung, and other well-known companies in the manufacturing and sales of personal handheld devices. Although eTech recognizes that it is a niche player and will likely remain so in the foreseeable future, it is trying to increase its current small market share in this huge competitive market. Jim Simons, VP of Production, and Catherine Dolans, VP of Marketing, have been discussing the possible addition of a new product to the companys current (rather limited) product line. The tentative name for this new product is ePlayerX. Jim and Catherine agree that the ePlayerX, which will feature a sleeker design and more memory, is necessary to compete successfully with the big boys, but they are also worried that the ePlayerX could cannibalize sales of their existing productsand that it could even detract from their bottom line. They must eventually decide how much to spend to develop and manufacture the ePlayerX and how aggressively to market it. Depending on these decisions, they must forecast demand for the ePlayerX, as well as sales for their existing products. They also realize that Apple. Samsung, and the other big players are not standing still. These competitors could introduce their own new products, which could have very negative effects on demand for the ePlayerX. The expected timeline for the ePlayerX is that development will take no more than a year to complete and that the product will be introduced in the market a year from now. Jim and Catherine are aware that there are lots of decisions to make and lots of uncertainties involved, but they need to start somewhere. To this end. Jim and Catherine have decided to base their decisions on a planning horizon of four years, including the development year. They realize that the personal handheld device market is very fluid, with updates to existing products occurring almost continuously. However, they believe they can include such considerations into their cost, revenue, and demand estimates, and that a four-year planning horizon makes sense. In addition, they have identified the following problem parameters. (In this first pass, all distinctions are binary: low-end or high-end, small-effect or large-effect, and so on.) In the absence of cannibalization, the sales of existing eTech products are expected to produce year I net revenues of 10 million, and the forecast of the annual increase in net revenues is 2%. The ePIayerX will be developed as either a low-end or a high-end product, with corresponding fixed development costs (1.5 million or 2.5 million), variable manufacturing costs ( 100 or 200). and selling prices (150 or 300). The fixed development cost is incurred now, at the beginning of year I, and the variable cost and selling price are assumed to remain constant throughout the planning horizon. The new product will be marketed either mildly aggressively or very aggressively, with corresponding costs. The costs of a mildly aggressive marketing campaign are 1.5 million in year 1 and 0.5 million annually in years 2 to 4. For a very aggressive campaign, these costs increase to 3.5 million and 1.5 million, respectively. (These marketing costs are not part of the variable cost mentioned in the previous bullet; they are separate.) Depending on whether the ePlayerX is a low-end or high-end produce the level of the ePlayerXs cannibalization rate of existing eTech products will be either low (10%) or high (20%). Each cannibalization rate affects only sales of existing products in years 2 to 4, not year I sales. For example, if the cannibalization rate is 10%, then sales of existing products in each of years 2 to 4 will be 10% below their projected values without cannibalization. A base case forecast of demand for the ePlayerX is that in its first year on the market, year 2, demand will be for 100,000 units, and then demand will increase by 5% annually in years 3 and 4. This base forecast is based on a low-end version of the ePlayerX and mildly aggressive marketing. It will be adjusted for a high-end will product, aggressive marketing, and competitor behavior. The adjustments with no competing product appear in Table 2.3. The adjustments with a competing product appear in Table 2.4. Each adjustment is to demand for the ePlayerX in each of years 2 to 4. For example, if the adjustment is 10%, then demand in each of years 2 to 4 will be 10% lower than it would have been in the base case. Demand and units sold are the samethat is, eTech will produce exactly what its customers demand so that no inventory or backorders will occur. Table 2.3 Demand Adjustments When No Competing Product Is Introduced Table 2.4 Demand Adjustments When a Competing Product Is Introduced Because Jim and Catherine are approaching the day when they will be sharing their plans with other company executives, they have asked you to prepare an Excel spreadsheet model that will answer the many what-if questions they expect to be asked. Specifically, they have asked you to do the following: You should enter all of the given data in an inputs section with clear labeling and appropriate number formatting. If you believe that any explanations are required, you can enter them in text boxes or cell comments. In this section and in the rest of the model, all monetary values (other than the variable cost and the selling price) should be expressed in millions of dollars, and all demands for the ePlayerX should be expressed in thousands of units. You should have a scenario section that contains a 0/1 variable for each of the binary options discussed here. For example, one of these should be 0 if the low-end product is chosen and it should be 1 if the high-end product is chosen. You should have a parameters section that contains the values of the various parameters listed in the case, depending on the values of the 0/1 variables in the previous bullet For example, the fixed development cost will be 1.5 million or 2.5 million depending on whether the 0/1 variable in the previous bullet is 0 or 1, and this can be calculated with a simple IF formula. You can decide how to implement the IF logic for the various parameters. You should have a cash flows section that calculates the annual cash flows for the four-year period. These cash flows include the net revenues from existing products, the marketing costs for ePlayerX, and the net revenues for sales of ePlayerX (To calculate these latter values, it will help to have a row for annual units sold of ePlayerX.) The cash flows should also include depreciation on the fixed development cost, calculated on a straight-line four-year basis (that is. 25% of the cost in each of the four years). Then, these annual revenues/costs should be summed for each year to get net cash flow before taxes, taxes should be calculated using a 32% tax rate, and taxes should be subtracted and depreciation should be added back in to get net cash flows after taxes. (The point is that depreciation is first subtracted, because it is not taxed, but then it is added back in after taxes have been calculated.) You should calculate the company's NPV for the four-year horizon using a discount rate of 10%. You can assume that the fixed development cost is incurred now. so that it is not discounted, and that all other costs and revenues are incurred at the ends of the respective years. You should accompany all of this with a line chart with three series: annual net revenues from existing products; annual marketing costs for ePlayerX; and annual net revenues from sales of ePlayerX. Once all of this is completed. Jim and Catherine will have a powerful tool for presentation purposes. By adjusting the 0/1 scenario variables, their audience will be able to see immediately, both numerically and graphically, the financial consequences of various scenarios.Based on Babich (1992). Suppose that each week each of 300 families buys a gallon of orange juice from company A, B, or C. Let pA denote the probability that a gallon produced by company A is of unsatisfactory quality, and define pB and pC similarly for companies B and C. If the last gallon of juice purchased by a family is satisfactory, the next week they will purchase a gallon of juice from the same company. If the last gallon of juice purchased by a family is not satisfactory, the family will purchase a gallon from a competitor. Consider a week in which A families have purchased juice A, B families have purchased juice B, and C families have purchased juice C. Assume that families that switch brands during a period are allocated to the remaining brands in a manner that is proportional to the current market shares of the other brands. For example, if a customer switches from brand A, there is probability B/(B + C) that he will switch to brand B and probability C/(B + C) that he will switch to brand C. Suppose that the market is currently divided equally: 10,000 families for each of the three brands. a. After a year, what will the market share for each firm be? Assume pA = 0.10, pB = 0.15, and pC = 0.20. (Hint: You will need to use the RISKBINOMLAL function to see how many people switch from A and then use the RISKBENOMIAL function again to see how many switch from A to B and from A to C. However, if your model requires more RISKBINOMIAL functions than the number allowed in the academic version of @RISK, remember that you can instead use the BENOM.INV (or the old CRITBENOM) function to generate binomially distributed random numbers. This takes the form =BINOM.INV (ntrials, psuccess, RAND()).) b. Suppose a 1% increase in market share is worth 10,000 per week to company A. Company A believes that for a cost of 1 million per year it can cut the percentage of unsatisfactory juice cartons in half. Is this worthwhile? (Use the same values of pA, pB, and pC as in part a.)Play Things is developing a new Lady Gaga doll. The company has made the following assumptions: The doll will sell for a random number of years from 1 to 10. Each of these 10 possibilities is equally likely. At the beginning of year 1, the potential market for the doll is two million. The potential market grows by an average of 4% per year. The company is 95% sure that the growth in the potential market during any year will be between 2.5% and 5.5%. It uses a normal distribution to model this. The company believes its share of the potential market during year 1 will be at worst 30%, most likely 50%, and at best 60%. It uses a triangular distribution to model this. The variable cost of producing a doll during year 1 has a triangular distribution with parameters 15, 17, and 20. The current selling price is 45. Each year, the variable cost of producing the doll will increase by an amount that is triangularly distributed with parameters 2.5%, 3%, and 3.5%. You can assume that once this change is generated, it will be the same for each year. You can also assume that the company will change its selling price by the same percentage each year. The fixed cost of developing the doll (which is incurred right away, at time 0) has a triangular distribution with parameters 5 million, 7.5 million, and 12 million. Right now there is one competitor in the market. During each year that begins with four or fewer competitors, there is a 25% chance that a new competitor will enter the market. Year t sales (for t 1) are determined as follows. Suppose that at the end of year t 1, n competitors are present (including Play Things). Then during year t, a fraction 0.9 0.1n of the company's loyal customers (last year's purchasers) will buy a doll from Play Things this year, and a fraction 0.2 0.04n of customers currently in the market ho did not purchase a doll last year will purchase a doll from Play Things this year. Adding these two provides the mean sales for this year. Then the actual sales this year is normally distributed with this mean and standard deviation equal to 7.5% of the mean. a. Use @RISK to estimate the expected NPV of this project. b. Use the percentiles in @ RISKs output to find an interval such that you are 95% certain that the companys actual NPV will be within this interval.
- Although the normal distribution is a reasonable input distribution in many situations, it does have two potential drawbacks: (1) it allows negative values, even though they may be extremely improbable, and (2) it is a symmetric distribution. Many situations are modelled better with a distribution that allows only positive values and is skewed to the right. Two of these that have been used in many real applications are the gamma and lognormal distributions. @RISK enables you to generate observations from each of these distributions. The @RISK function for the gamma distribution is RISKGAMMA, and it takes two arguments, as in =RISKGAMMA(3,10). The first argument, which must be positive, determines the shape. The smaller it is, the more skewed the distribution is to the right; the larger it is, the more symmetric the distribution is. The second argument determines the scale, in the sense that the product of it and the first argument equals the mean of the distribution. (The mean in this example is 30.) Also, the product of the second argument and the square root of the first argument is the standard deviation of the distribution. (In this example, it is 3(10=17.32.) The @RISK function for the lognormal distribution is RISKLOGNORM. It has two arguments, as in =RISKLOGNORM(40,10). These arguments are the mean and standard deviation of the distribution. Rework Example 10.2 for the following demand distributions. Do the simulated outputs have any different qualitative properties with these skewed distributions than with the triangular distribution used in the example? a. Gamma distribution with parameters 2 and 85 b. Gamma distribution with parameters 5 and 35 c. Lognormal distribution with mean 170 and standard deviation 60Lemingtons is trying to determine how many Jean Hudson dresses to order for the spring season. Demand for the dresses is assumed to follow a normal distribution with mean 400 and standard deviation 100. The contract between Jean Hudson and Lemingtons works as follows. At the beginning of the season, Lemingtons reserves x units of capacity. Lemingtons must take delivery for at least 0.8x dresses and can, if desired, take delivery on up to x dresses. Each dress sells for 160 and Hudson charges 50 per dress. If Lemingtons does not take delivery on all x dresses, it owes Hudson a 5 penalty for each unit of reserved capacity that is unused. For example, if Lemingtons orders 450 dresses and demand is for 400 dresses, Lemingtons will receive 400 dresses and owe Jean 400(50) + 50(5). How many units of capacity should Lemingtons reserve to maximize its expected profit?W. L. Brown, a direct marketer of womens clothing, must determine how many telephone operators to schedule during each part of the day. W. L. Brown estimates that the number of phone calls received each hour of a typical eight-hour shift can be described by the probability distribution in the file P10_33.xlsx. Each operator can handle 15 calls per hour and costs the company 20 per hour. Each phone call that is not handled is assumed to cost the company 6 in lost profit. Considering the options of employing 6, 8, 10, 12, 14, or 16 operators, use simulation to determine the number of operators that minimizes the expected hourly cost (labor costs plus lost profits).