n estimating the regression in problem #2 you are also 4. concemed that the tstatistics may be inflated because of the presence of conditional heteroscedasticity.
n estimating the regression in problem #2 you are also 4. concemed that the tstatistics may be inflated because of the presence of conditional heteroscedasticity.

College Algebra
7th Edition
ISBN:9781305115545
Author:James Stewart, Lothar Redlin, Saleem Watson
Publisher:James Stewart, Lothar Redlin, Saleem Watson
Chapter1: Equations And Graphs
Section: Chapter Questions
Problem 10T: Olympic Pole Vault The graph in Figure 7 indicates that in recent years the winning Olympic men’s...

Related questions
Question
The questions are correlated to the ones that I have added before it's a set of 4 qstns
Transcribed Image Text:n estimating the regression in problem #2 you are also
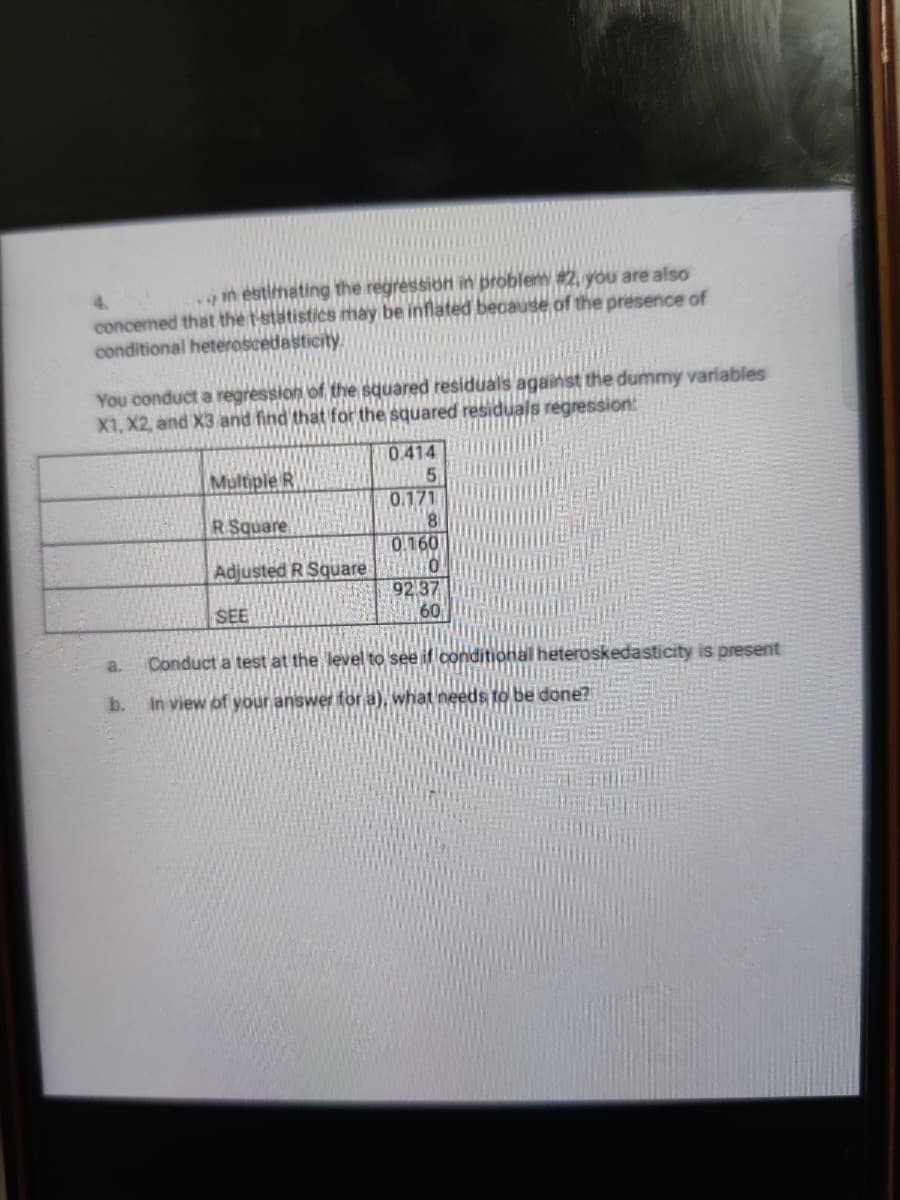
4.
concened that the t-statistics may be inflated because of the presence of
conditional heteroscedasticity.
You conduct a regression of the squared residuals against the dummy variables
X1, X2, and X3 and find that for the squared residuals regression:
0.414
Multiple R
0.171
81
0.160
R Square
Adjusted R Square
92 37
60
SEE
a.
Conduct a test at the level to see if conditional heteroskedasticity is present
b.
in view of your answer for a), what needs to be done?
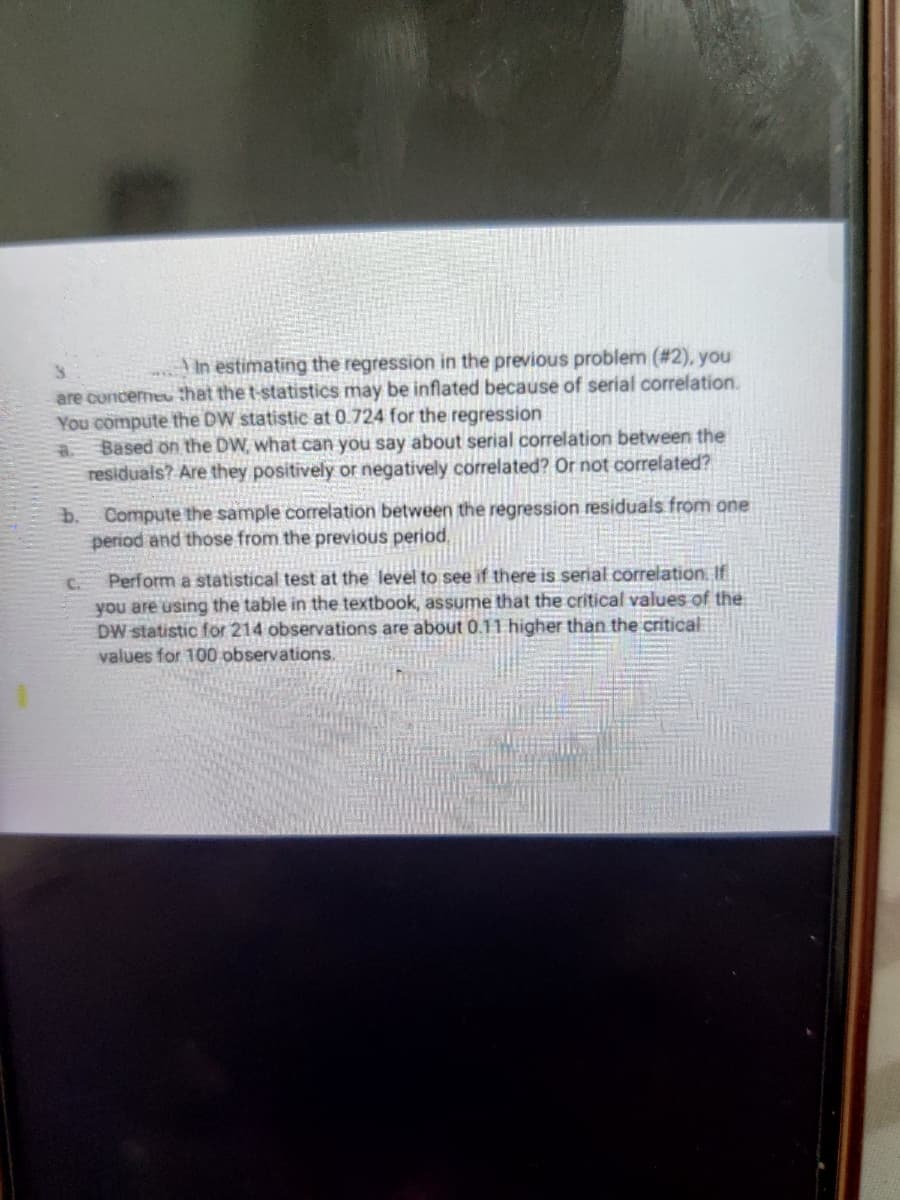
Transcribed Image Text:A In estimating the regression in the previous problem (#2), you
are concemeu that the t-statistics may be inflated because of serial correlation.
You compute the DW statistic at 0.724 for the regression
Based on the DW, what can you say about serial correlation between the
residuals? Are they positively or negatively correlated? Or not correlated?
b.
Compute the sample correlation between the regression residuals from one
period and those from the previous period,
C.
Perform a statistical test at the level to see if there is serial correlation, If
you are using the table in the textbook, assume that the critical values of the
DW statistic for 214 observations are about 0.11 higher than the critical
values for 100 observations.
Expert Solution
This question has been solved!
Explore an expertly crafted, step-by-step solution for a thorough understanding of key concepts.

This is a popular solution!

Trending now
This is a popular solution!

Step by step
Solved in 5 steps with 1 images

Recommended textbooks for you
College Algebra
Algebra
ISBN:
9781305115545
Author:
James Stewart, Lothar Redlin, Saleem Watson
Publisher:
Cengage Learning

Glencoe Algebra 1, Student Edition, 9780079039897…
Algebra
ISBN:
9780079039897
Author:
Carter
Publisher:
McGraw Hill
College Algebra
Algebra
ISBN:
9781305115545
Author:
James Stewart, Lothar Redlin, Saleem Watson
Publisher:
Cengage Learning
Glencoe Algebra 1, Student Edition, 9780079039897…
Algebra
ISBN:
9780079039897
Author:
Carter
Publisher:
McGraw Hill