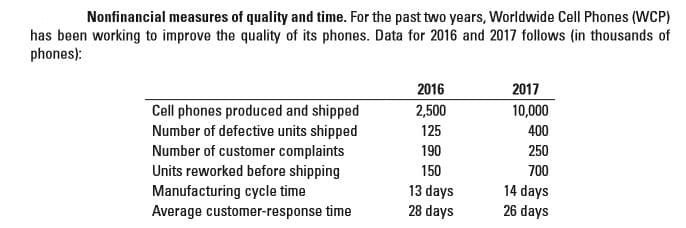
Nonfinancial measures of quality and time. For the past two years, Worldwide Cell Phones (WCP) has been working to improve the quality of its phones. Data for 2016 and 2017 follows (in thousands of phones): 2016 2,500 125 190 150 13 days 28 days 2017 Cell phones produced and shipped Number of defective units shipped Number of customer complaints Units reworked before shipping Manufacturing cycle time Average customer-response time 10,000 400 250 700 14 days 26 days
Q: A company currently using an inspection process in its material receiving department is trying to…
A: Solution: The number of expected rejection
Q: In response to intensive foreign competition, the management of Florex Company has attempted over…
A: Step 1: Cost report is a financial report, which identifies cost and charges to various activities.…
Q: Silver Lining Inc. has a balanced scorecard with a strategy map that shows that delivery time and…
A: Solution- Target hours from orderd to delivered =40 hours Actual average total hours=27.5+16.3=43.8…
Q: Ram Co. produces one product and it seems that the demand for that product is exceeding their…
A: Overall Equipment Effectiveness (OEE) is ratio which shows the fully productive time against the…
Q: What nonfinancial and qualitative factors should Crimson consider in making the decision?
A: Variable Cost: The Variable cost is that cost which varies with increase or decrease in the level…
Q: The management of Boogie Company thinks that its total costs of quality can be reduced by increasing…
A: Cost of quality is a method in which a company calculates how its resources, be it funds or time,…
Q: The management of Boogie Company thinks that its total costs of quality can be reduced by increasing…
A: There are 4 types of cost of quality categories Prevention Costs Appraisal Costs Cost due to…
Q: Management of Mittel Company would like to reduce the amount of time between when a customer places…
A: Through put time: The amount of time required for during manufacturing process for converting raw…
Q: Clason, Inc. manufactures door panels. Suppose clason is considering sending the following amounts…
A: Cost of new quality program = 68000 + 27000+ 39000 +58000 = $ 192000 Cost of old program = 86000+…
Q: Golf courses are demanding in their quest for high-quality carts because of the critical need for…
A: Formula used: Lost profit=Number of units sold×Lost profit per tank Total failure cost=Lost…
Q: The following costs were incurred by Osaka Metals Company to maintain the quality of its…
A:
Q: umbo Pty Ltd manufactures a number of products in its five departments. In the first department, car…
A: This problem is related to cost volume profit analysis. Many…
Q: Berlin Corp. makes a special-purpose machine called HTW used in the textile industry. Berlin Corp.…
A: Result:
Q: Techno Laboratories evaluates the reaction of materials to extreme increases in temperature. Much of…
A: Since we answer up to 3 sub-parts, we'll answer the first 3. Please resubmit the question and…
Q: Should SpeedPrint change to the new component? Show your calculations
A: Incremental analysis is made by a company to make the decision of introducing a new component. If…
Q: The demand for solvent, one of numerous products manufactured byLogan Industries Inc., has dropped…
A: I am answering the first three sub-parts as per bartleby guidelines. Please re-submit the remaining…
Q: Classifying quality costs and using these costs to make decisions Clason, Inc. manufactures door…
A: Prevention Costs = Training Employees in TQM + Training suppliers in TQM + Identifying suppliers who…
Q: Eagleson Company's quality cost report is to be based on the following data: Net cost of scrap $…
A: Lets understand the basics. Quality costs are divided into four types which are, (1) Internal…
Q: The Brisbane Manufacturing Company produces a single model of a CD player. Each player is sold for…
A: Net present value is the difference between present value of cash inflows and present value of cash…
Q: Lindell Manufacturing embarked on an ambitious quality program that is centered on continual…
A: Transparency, impartiality, and equality are characteristics of ethical behaviour in interpersonal,…
Q: The demand for solvent, one of numerous products manufactured by RZM Industries Inc., has dropped…
A: An income statement is a financial report that indicates the revenue and expenses of a business. It…
Q: Walton Company has measured its quality costs for the past two years. After the company gathers its…
A: Given, Cost of Quality: Particulars Last Year This Year Prevention costs 339,200 637,000…
Q: The factors that affect the productivity of camera/drone PATS include Coyb Des Sohe md constues…
A: The question is based on the concept of Accounting for decision making.
Q: A company's returns department incurs annual overhead costs of $333,000 and budgets 9,000 returns…
A: Overhead means the cost which is incurred indirectly and not directly.
Q: Pharasalia skincare Inc. has developed a new lotion that will help to improve skin ageing. Total…
A: Cost of Quality Cost of quality is a measure for estimating the expenses businesses expend to ensure…
Q: o customer returns. An income statement for the year follows. (See attached) a. Compute the total…
A: 1. Compute the total pre-tax profit lost by the company in its first year of operations by selling…
Q: For each period, calculate the ratio of each COQ category to revenues and to total quality costs
A:
Q: Cost-of-Quality Improvement—Relevant Cost Analysis PIM Industries Inc. manufactureselectronics…
A:
Q: Booster Company has been researching into new ways of manufacturing their products. The costs and…
A: IAS 38 APPLIES in above scenario
Q: Prepare a COQ report by calculating the costs of quality for each category and the ratio of each COQ…
A:
Q: cting invoice errors $10,000 Disposing of poor-quality…
A: Given: The data is given as below, Activity…
Q: At the beginning of the year, Devonshire Company initiated a quality improvement program. The…
A: Appraisal cost are Material inspections and product inspection. Material inspection = $8,000…
Q: Quality improvement, relevant costs, relevant revenues. SpeedPrint manufactures and sells 18,000…
A: 1. The company should introduce the new component as the additional contribution margin after the…
Q: DataSpan, Inc., automated its plant at the start of the current year and installed a flexible…
A: 1-a. Compute the throughput time for each month. 1-b. Compute the delivery cycle time for each…
Q: If NUBD Co. is able to reduce quality costs to 2.5% of sales, what will happen to profits? * NUBD…
A: A ) Computation of profit for 2021 :- Sales = P1,000,000. Less :- Total…
Q: Elijah Electronics makes wireless headphone sets. The firm produced 58,500 wireless headphone sets…
A: Failure cost refers to the cost incurred due to producing defective goods. It comprises internal and…
Q: The Brisbane Manufacturing Company produces a single model of a CD player. Each player is sold for…
A: Hi student Since there are multiple subparts, we will answer only first three subparts. If you want…
Q: Co. uses corrugated cardboard to ship its product to customers. Currently, the compan rhead costs of…
A: Standard overhead rate per unit is the overheads calculated per unit. It is calculated by dividing…
Q: Oakwood Company produces maple bookcases. The following information is available for the production…
A: 1.
Q: The demand for aloe vera hand lotion, one of numerous products manufactured by Smooth Skin Care…
A: Note: Since we are entitled to answer up to 3 sub-parts, we’ll answer the first 3. Please resubmit…
Q: At the beginning of the year, Kowalski Company initiated a quality improvement program. The program…
A: The net income is the net profit of the company earned during the period. The net income includes…
Q: Supreme Furniture needs to purchase glass panes to make glass top coffee tables. Last year Supreme…
A: Activity based costing means where the product is valued on the basis of actual direct material ,…
Q: Direct-cost and selling price variances. MicroDisk is the market leader in the Secure Digital (SD)…
A: As the question has more than 3 sub-parts, the first 3 subparts are answered. If you want the answer…
For each year, 2016 and 2017, calculate the Customer complaints as a percentage of units shipped
Trending now
This is a popular solution!
Step by step
Solved in 3 steps with 3 images
- Nonnancial measures of quality and time. For the past two years, Worldwide Cell Phones (WCP) has been working to improve the quality of its phones. Data for 2016 and 2017 follows (in thousands of phones):DataSpan, Inc., automated its plant at the start of the current year and installed a flexiblemanufacturing system. The company is also evaluating its suppliers and moving toward LeanProduction. Many adjustment problems have been encountered, including problems relating toperformance measurement. After much study, the company has decided to use the performancemeasures below, and it has gathered data relating to these measures for the first four months ofoperations.Month1 2 3 4Throughput time (days) ? ? ? ?Delivery cycle time (days) ? ? ? ?Manufacturing cycle efficiency (MCE) ? ? ? ?Percentage of on-time deliveries 91% 86% 82% 78%Total sales (units) 3460 3312 3143 3025Management has asked for your help in computing throughput time, delivery cycle time, and MCE.The following average times have been logged over the last four months: Average per Month (in days)1 2 3 4Move time per unit 0.7 0.5 0.6 0.6Process time per unit 2.8 2.7 2.6 2.5Wait time per order before start of production 23.0…In 20X1, Don Blackburn, president of Price Electronics, received a report indicating that quality costs were 31% of sales. Faced with increasing pressures from imported goods. Don resolved to take measures to improve the overall quality of the companys products. After hiring a consultant in 20X1, the company began an aggressive program of total quality control. At the end of 20X5, Don requested an analysis of the progress the company had made in reducing and controlling quality costs. The accounting department assembled the following data: Required: 1. Compute the quality costs as a percentage of sales by category and in total for each year. 2. Prepare a multiple-year trend graph for quality costs, both by total costs and by category. Using the graph, assess the progress made in reducing and controlling quality costs. Does the graph provide evidence that quality has improved? Explain. 3. Using the 20X1 quality cost relationships (assume all costs are variable), calculate the quality costs that would have prevailed in 20X4. By how much did profits increase in 20X4 because of the quality improvement program? Repeat for 20X5.
- Nabors Company had actual quality costs for the year ended June 30, 20x5, as given below. At the zero-defect state, Nabors expects to spend 375,000 on quality engineering, 75,000 on vendor certification, and 50,000 on packaging inspection. Assume sales to be 25,000,000. Required: 1. Prepare a long-range performance report for 20x5. What does this report tell the management of Nabors? 2. Explain why quality costs still are present for the zero-defect state. 3. What if Nabors achieves the zero-defect state reflected in the report? What are some of the implications of this achievement?Suppose that Kicker had the following sales and cost experience (in thousands of dollars) for May of the current year and for May of the prior year: In May of the prior year, Kicker started an intensive quality program designed to enable it to build original equipment manufacture (OEM) speaker systems for a major automobile company. The program was housed in research and development. In the beginning of the current year, Kickers accounting department exercised tighter control over sales commissions, ensuring that no dubious (e.g., double) payments were made. The increased sales in the current year required additional warehouse space that Kicker rented in town. (Round ratios to four decimal places. Round sales dollars computations to the nearest dollar.) Required: 1. Calculate the contribution margin ratio for May of both years. 2. Calculate the break-even point in sales dollars for both years. 3. Calculate the margin of safety in sales dollars for both years. 4. CONCEPTUAL CONNECTION Analyze the differences shown by your calculations in Requirements 1, 2, and 3.Recently, Ulrich Company received a report from an external consulting group on its quality costs. The consultants reported that the companys quality costs total about 21 percent of its sales revenues. Somewhat shocked by the magnitude of the costs, Rob Rustin, president of Ulrich Company, decided to launch a major quality improvement program. For the coming year, management decided to reduce quality costs to 17 percent of sales revenues. Although the amount of reduction was ambitious, most company officials believed that the goal could be realized. To improve the monitoring of the quality improvement program, Rob directed Pamela Golding, the controller, to prepare monthly performance reports comparing budgeted and actual quality costs. Budgeted costs and sales for the first two months of the year are as follows: The following actual sales and actual quality costs were reported for January: Required: 1. Reorganize the monthly budgets so that quality costs are grouped in one of four categories: appraisal, prevention, internal failure, or external failure. (Essentially, prepare a budgeted cost of quality report.) Also, identify each cost as variable (V) or fixed (F). (Assume that no costs are mixed.) 2. Prepare a performance report for January that compares actual costs with budgeted costs. Comment on the companys progress in improving quality and reducing its quality costs.
- The Port Authority sells a wide variety of cables and adapters for electronic equipment online. Last year the mean value of orders placed with the Port Authority was 47.28, and management wants to assess whether the mean value of orders placed to date this year is the same as last year. The values of a sample of 49,896 orders placed this year are collected and recorded in the tile PortAuthority. a. Formulate hypotheses that can be used to test whether the mean value of orders placed this year differs from the mean value of orders placed last year. b. Use the data in the file PortAuthority to conduct your hypothesis test. What is the p value for your hypothesis test? At = 0.01, what is your conclusion?In 2011, Milton Thayne, president of Carbondale Electronics, received a report indicating that quality costs were 31 percent of sales. Faced with increasing pressures from imported goods, Milton resolved to take measures to improve the overall quality of the companys products. After hiring a consultant in 20x0, the company began an aggressive program of total quality control. At the end of 20x5, Milton requested an analysis of the progress the company had made in reducing and controlling quality costs. The Accounting Department assembled the following data: Required: 1. Compute the quality costs as a percentage of sales by category and in total for each year. 2. Prepare a multiple-year trend graph for quality costs, both by total costs and by category. Using the graph, assess the progress made in reducing and controlling quality costs. Does the graph provide evidence that quality has improved? Explain. 3. Using the 20x1 quality cost relationships (assume all costs are variable), calculate the quality costs that would have prevailed in 20x4. By how much did profits increase in 20x4 because of the quality improvement program? Repeat for 20x5.Rizzo Goal Inc. produces and sells hockey equipment, often custom made for online orders. The company has the following performance metrics on its balanced scorecard: days from ordered to delivered, number of shipping errors, customer retention rate, and market share. A measure map illustrates that the days from ordered to delivered and the number of shipping errors are both expected to directly affect the customer retention rate, which affects market share. Additional internal analysis finds that: Every shipping error over three shipping errors per month reduces the customer retention rate by 1.5%. On average, each day above three days from ordered to delivered yields a reduction in the customer retention rate of 1%. Each day before three days from order to delivery yields an increase in the customer retention rate of 1%, on average. Rizzo Goal Inc.s current customer retention rate is 60%. The company estimates that for every 1% increase or decrease in the customer retention rate, market share changes 0.5% in the same direction. Rizzo Goal Inc.s current market share is 21.4%. Ignoring any other factors, if the company has six shipping errors this month and an average of 3.5 days from ordered to delivered, determine (a) the new customer retention rate and (b) the new market share that Rizzo Goal Inc. expects to have.
- The controller of Emery, Inc. has computed quality costs as a percentage of sales for the past 5 years (20X1 was the first year the company implemented a quality improvement program). This information is as follows: Required: 1. Prepare a trend graph for total quality costs. Comment on what the graph has to say about the success of the quality improvement program. 2. Prepare a graph that shows the trend for each quality cost category. What does the graph have to say about the success of the quality improvement program? Does this graph supply more insight than the total cost trend graph does? 3. Prepare a graph that compares the trend in relative control costs versus relative failure costs. Comment on the significance of this trend.In 20x5, Major Company initiated a full-scale, quality improvement program. At the end of the year, Jack Aldredge, the president, noted with some satisfaction that the defects per unit of product had dropped significantly compared to the prior year. He was also pleased that relationships with suppliers had improved and defective materials had declined. The new quality training program was also well accepted by employees. Of most interest to the president, however, was the impact of the quality improvements on profitability. To help assess the dollar impact of the quality improvements, the actual sales and the actual quality costs for 20x4 and 20x5 are as follows by quality category: All prevention costs are fixed (by discretion). Assume all other quality costs are unit-level variable. Required: 1. Compute the relative distribution of quality costs for each year and prepare a pie chart. Do you believe that the company is moving in the right direction in terms of the balance among the quality cost categories? Explain. 2. Prepare a one-year trend performance report for 20x5 (compare the actual costs of 20x5 with those of 20x4, adjusted for differences in sales volume). How much have profits increased because of the quality improvements made by Major Company? 3. Estimate the additional improvement in profits if Major Company ultimately reduces its quality costs to 2.5 percent of sales revenues (assume sales of 10 million).Mantenga Company provides routine maintenance services for heavy moving and transportation vehicles. Although the vehicles vary, the maintenance services provided follow a fairly standard pattern. Recently, a potential customer has approached the company, requesting a new maintenance service for a radically different type of vehicle. New servicing equipment and some new labor skills will be needed to provide the maintenance service. The customer is placing an initial order to service 150 vehicles and has indicated that if the service is satisfactory, several additional orders of the same size will be placed every 3 months over the next 3 to 5 years. Mantenga uses a standard costing system and wants to develop a set of standards for the new vehicle. The usage standards for direct materials such as oil, lubricants, and transmission fluids were easily established. The usage standard is 25 quarts per servicing, with a standard cost of 4 per quart. Management has also decided on standard rates for labor and overhead. The standard labor rate is 15 per direct labor hour, the standard variable overhead rate is 8 per direct labor hour, and the standard fixed overhead rate is 12 per direct labor hour. The only remaining decision is the standard for labor usage. To assist in developing this standard, the engineering department has estimated the following relationship between units serviced and average direct labor hours used: As the workers learn more about servicing the new vehicles, they become more efficient, and the average time needed to service one unit declines. Engineering estimates that all of the learning effects will be achieved by the time that 320 units are produced. No further improvement will be realized past this level. Required: 1. Assume that the average labor time is 0.768 hour per unit after the learning effects are achieved. Using this information, prepare a standard cost sheet that details the standard service cost per unit. (Note: Round costs to two decimal places.) 2. CONCEPTUAL CONNECTION Given the per-unit labor standard set, would you expect a favorable or an unfavorable labor efficiency? Explain. Calculate the labor efficiency variance for servicing the first 320 units. 3. CONCEPTUAL CONNECTION Assuming no further improvement in labor time per unit is possible past 320 units, explain why the cumulative average time per unit at 640 units is lower than the time at 320 units. Show that the standard labor time should be 0.768 hour per unit. Explain why this value is a good choice for the per-unit labor standard.