QUESTION 1 
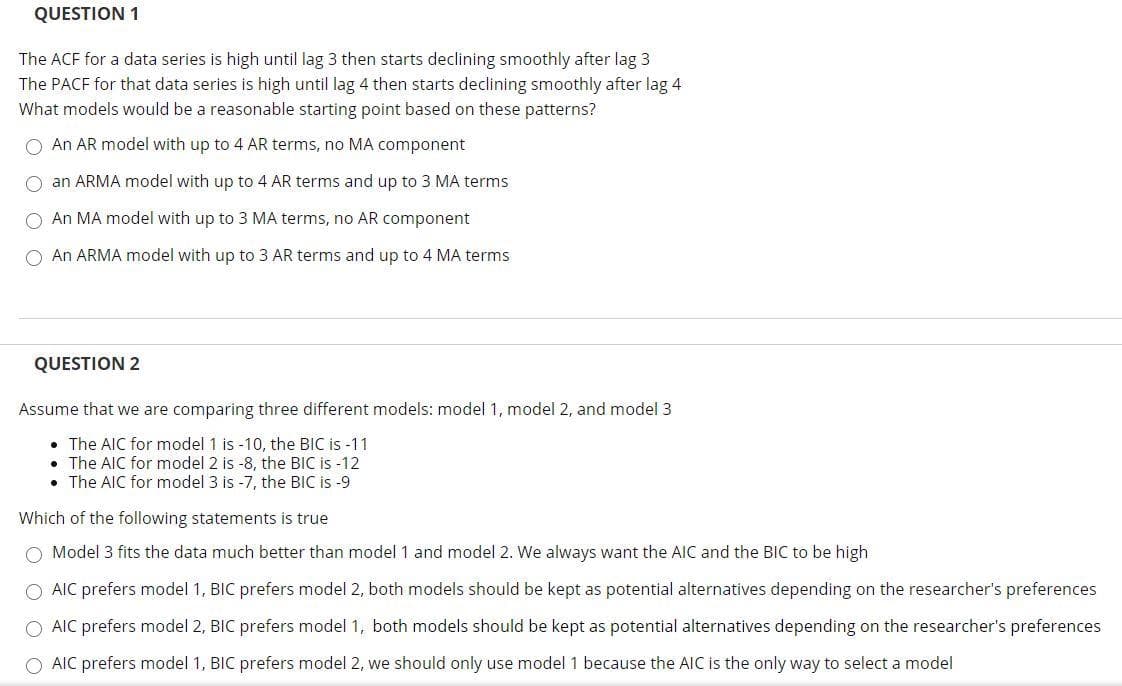
The ACF for a data series is high until lag 3 then starts declining smoothly after lag 3 The PACF for that data series is high until lag 4 then starts declining smoothly after lag 4 What models would be a reasonable starting point based on these patterns? An AR model with up to 4 AR terms, no MA component an ARMA model with up to 4 AR terms and up to 3 MA terms O An MA model with up to 3 MA terms, no AR component O An ARMA model with up to 3 AR terms and up to 4 MA terms
Q: QUESTION 15 In a certain village accidents occur infrequently. It is known that the probability of…
A: Given : n=300 P=0.02
Q: Question 30. Given a sample of n=5 data values: X1=12, x2 23, x3=26, x4=28, and xs = 10 %3D %3D Up…
A: We have given a sample of n=5 data values i.e., x1=12, x2=23, x3=26, x4=28, and x5=10
Q: [Please read and understand Lecture 02 notes, Section 2] Given a short time-series {0.1, 0.2, 0.3,…
A:
Q: A regression model involved 8 independent variables and 153 observations. The critical value of t…
A:
Q: Question 1 The below graph plots the daily prices of Gold over time. a) Examine the plot and…
A: Answer 1 : a) The given plot has the follwoing issues: Very short run data which is quite volatile…
Q: A political scientist obtained recordings of election-night acceptance speeches of 20 newly elected…
A: From the above data "A political scientist obtained recordings of election-night acceptance…
Q: Question 3 We have a time series dataset from the US which includes the following variables for the…
A: The objective of is to test the significance of the coefficient PB at 10% level of significance.…
Q: Question 1 The following table shows the number of shirts by sizes that are manufactured in a…
A: i). Since the population size is large, therefore it is difficult to examine the entire weekly…
Q: QUESTION 1 Suppose you estimate the following results: hourly_wage=5.5+ 0.50edu + 0.10exper+…
A:
Q: Question 03: In the past, Judy Holmes's tire dealership sold radial tires each year given YEAR SALES…
A: Given:
Q: Question 3 Let P be a random variable having a uniform distribution with minimum 0 and maximum 3…
A: The probability density function for the random variable P~Uniform0,3 is, fx=13-0=13 for 0≤x≤3=0…
Q: Suppose the following are the seasonal indices for the first three quarters of the year for a…
A: Given, Seasonal index for Q4 is 100 Intercept = 2494, Time = 64.6 => a = 2494, b = 64.6
Q: QUESTION 2 The molecular weight of a particular polymer should fall between 167 and 479. Fourty…
A: We have given that Mean = 271 Standard deviation = 65 The molecular weight is normally distributed.
Q: Question 3a. The bookstore wanted to know whether either cardholder members or non-members purchase…
A:
Q: QUESTION 3 Matt has inherited a large sum of money wo and is deciding how much to invest in a low…
A:
Q: produced
A: 1) In this case the population size is large so it will be some difficult and take long time to…
Q: uestion 10 Suppose I meet with the parole board to see if I should be paroled. The parole board…
A: Hypothesis testing is the procedure analysing and assumption regarding the population parameter.
Q: QUESTION 5 5 points Save Ans Exams are approaching and Helen is allocating time to studying for…
A: Dependent and independent events
Q: Question 18: Many investors and financial analysts believe the Dow Jones Industrial Average (DJIA)…
A:
Q: Question 2 The results of unit root test are presented in Table 1(a) and (b) below. Briefly explain…
A: Table 1 (a) Null Hypothesis: LNGDP has a unit root. t statistic = 0.115497 The critical values at…
Q: Question 10 Consider the model of competitive insurance discussed in lectures (Topic 6.7). Peter is…
A:
Q: For the completion of a given process, the raw data showed a statistical average time of 2.07…
A: As per POLICY I HAVE CALCULATED FIRST MAIN QUESTION Here given completion of a given process, the…
Q: Exhibit 17-2Consider the following time series: t 1 2 3 4 Yi 4 7 9 10 Refer to Exhibit 17-2.…
A: The correct answer is option (C) 22.5.
Q: Question 4: Rivers in North Carolina contain small concentrations of mercury that can accumulate in…
A: The table shows the length and weight for the fishes.
Q: Suppose the following are the seasonal indices for the first three quarters of the year for a…
A: Given, the following are the seasonal indices for the first three quarters of the year for a…
Q: Question 26 > A random sample of 322 residents of a city found that 68.6% approved of the mayor's…
A:
Q: Suppose the following are the seasonal indices for the first three quarters of the year for a…
A: Given, The seasonal index for Q1 = 72.2 Intercept a = 1993 Slope b = 75.3 Here, we have to find the…
Q: QUESTION 1 Suppose you estimate the following results: hourly_wage=5.5 +0.50edu + 0.10exper+…
A: Given that, Hourly wage=5.5+0.50edu+0.10exper+0.10(edu*exper) Standard error for beta0hat is…
Q: A small pilot study is conducted to investigate the effect of a nutritional supplement on total body…
A: Solution: 1. State the hypotheses. Null hypothesis: H0:µd≥0 That is, there is no significant…
Q: QUESTION 16 Which of the following statements is correct? a. Weakly dependent processes are said to…
A: The weekly dependent processes are said to be integrated of order zero, or I(0). Thus we can say the…
Q: Question 17 The estimated GARCH volatility model parameters and t-statistics are given below. What…
A: Given Param and t-list Find The correct option among 4
Q: A learn.hawkeslearning.com A Assignment Module 6/ Chapter 9 Question 7 of 16 Step 1 of 1| Hawkes…
A: To find The simple interest earned on $10000 for 30 years pf APR 7%
Q: 1. Question Table 1.8 Revenues of the Past Five Years Year 1 3 4 Revenues ($) 10 12 15 13 16 Table…
A: Given, The time series data of certain revenue for five years Year 1 2 3 4 5 Revenue 10 12 15…
Q: QUESTION 4 What is the probability that 6 spins are pointing up in an 18-spin system? Your answer…
A: Number of favorable event = 6 Number of total event = 18 Since by definition of probability =…
Q: Suppose the following are the seasonal indices for the first three quarters of the year for a…
A:
Q: Suppose the following are the seasonal indices for the first three quarters of the year for a…
A: See the handwritten solution
Q: Question 2 A student has two samples of NaCl, each one from a different source. Assume that the only…
A: From the question there are two Samples of NaCl from different sources that has a containment of KCl…
Q: QUESTION 12 With alpha and N held constant, as the effect of the independent variable increases O…
A: With alpha and N held constant, the effect of the independent variable increase the probability of…
Q: Question No 3 A small project is composed of 7 activities whose time estimates are listed in the…
A: given there are 7 activities to calculate variance and standard deviation
Q: Question 6 State whether the data is cross section or time series. The daily number of houses sold…
A: Time series analysis is the specific way of studying and analyzing time series data. Time is an…
Q: It is important to consider the possibility of a type II error when a nonparametric test fails to…
A: In this case, we need to identify the given statement is true or not.
Q: QUESTION 3 Which of the following statements is correct? a.A finite distributed lag (FDL) model is…
A: The answer is as follows:
Q: QUESTION 1 In a certain village accidents occur infrequently. It is known that the probability of an…
A: Note: Since you have posted multiple independent questions in the same request, we will solve the…
Q: Question 7 The following plots have been obtained for a time series. a) Suggest an appropriate ARIMA…
A: b) For model 1 arima011 have AIC and BIC values are less than that of other two model.Therefore,…
Q: QUESTION 3 Suppose the following are the seasonal indices for the first three quarters of the year…
A: Let seasonal index for Quarter 4 be Q4: So, Deseasonalised series for time = 1,2,3,4:
Q: Question 6: A hypothesis test results in the rejection of the null hypothesis at significance level…
A: Answers are Question 6 : (d) Question 7 : (b)
Q: Match the p-values with the appropriate conclusion: I. 0.00001 II. 0.0297 III. 0.0721 IV. 0.4490…
A: (d). The result is significant at a 5% level but not at a 1% level. Means the p-value should be…
Q: Question 7 The following plots have been obtained for a time series. a) Suggest an appropriate ARIMA…
A: *Answer:
Q: Question 4 X1, X2, ..., Xn are i.i.d. random variables from N(0,0) distribution. Here, 0 o² > 0 is…
A:
Trending now
This is a popular solution!
Step by step
Solved in 2 steps
- Question 2 The past records of a supermarket show that its customers spend an average of $65 per visit at this store. Recently the management of the store initiated a promotional campaign according to which each customer receives points based on the total money spent at the store, and these points can be used to buy products at the store. The management expects that as a result of this campaign, the customers should be encouraged to spend more money at the store. To check whether this is true, the manager of the store took a sample of 12 customers who visited the store. The following data give the money (in dollars) spent by these customers at this supermarket during their visits. 88 69 141 28 106 45 32 51 78 54 110 83 Assume that the money spent by all customers at this supermarket has a normal distribution. Using the 5% significance level, can you conclude that the mean amount of money spend by all customers at this supermarket after the campaign was started is more than $65?Question 6 The revenue per month earned by the Couture clothing chain at time tis R(t) = N(t)S(t), where N(t) is the number of stores and S(t) is the average revenue per store per month. Couture releases a statement to their investors saying that currently they have 50 stores with a total revenue of $7,500,000 and expect to increase the number of stores by about 2 stores per month and increase total revenue by about $250,000 per month. What does this statement imply about the current rate of change of the average revenue per store per month?QUESTION 5 A country club wants to exam the effects of a new marketing campaign that attempts to get more people within the community to become members. In many communities, when people buy a house in the area, they receive a “Welcome Wagon” gift basket containing coupons to local restaurants. The idea of the marketing campaign is to include a free two month membership to the country club in the gift basket with the hope that once “new” residents try the country club then at least a certain proportion will want to become real members. One member of the Club’s Executive Council believes that at least 80% of the people who receive the coupons for the free membership will use the coupon. In a sample of 197 new residents who received the coupon for the two month free membership, there were 136 people who actually took advantage of the free two month membership. When testing the hypothesis that at least 80% of the people that receive the coupon actually use it, what is the test statistic?…
- Question 3 A Test the hypothesis that the average time NFL players spend standing around between plays during a game is 61.68 minutes at α=0.02. Step 1: H0: µ Ha: µ Step 2: = Step 3: Fill in the row if the hypothesis is one-tailed. Reject H0 if Fill in the row if the hypothesis is two tailed. The smaller number must be typed first. Reject H0 if or Step 4: = Step 5: H0 Step 6: Step 7: Fill in the row if the Z table is appropriate. P-value = Fill in the row if the t table is appropriate. The lower boundary must go on the left and the upper boundary on the right. P-value Question 3 B Construct a 80% confidence interval for the population average time NFL players spend standing around between plays during a game. Lower Endpoint Upper Endpoint Question 3 C What would the P-value be if this were a lower tail hypothesis test?…Exhibit 17-2Consider the following time series: t 1 2 3 4 Yi 4 7 9 10 Refer to Exhibit 17-2. The forecast for period 10 is ______. a. 10.0 b. 25.0 c. 22.5 d. 30.0part C D 33000331 UPH-1 St. Lawrence dolomite 618 0.05 2.69 2.74 2.83 48000168 Langer Platteville dolomite 127.8 0.06 2.69 2.75 2.86 52000415 3-21-13z1 Galena dolomite 575 0.04 2.72 2.76 2.83 52000415 3-21-13z1 Platteville dolomite 740 0.05 2.7 2.75 2.85 60000086 VD #1 Silurian dolomite 684 0.03 2.75 2.78 2.83 60000086 VD #1 Galena dolomite 1070 0.05 2.69 2.74 2.84 60000086 VD #1 Platteville dolomite 1142 0.02 2.77 2.79 2.83 13001466 NS-2 Tunnel City sandstone 60.1 0.14 2.41 2.54 2.79 13001466 NS-2 Tunnel City sandstone 60.2 0.28 1.93 2.21 2.67 13001466 NS-2 Tunnel City sandstone 118.3 0.3 1.88 2.18 2.7 33000331 UPH-1 St. Peter sandstone 222 0.22 2.06 2.28 2.65 33000331 UPH-1 Jordan sandstone 531 0.21 2.09 2.3 2.65 33000331 UPH-1 Tunnel City sandstone 644 0.18 2.22 2.4 2.7 33000331 UPH-1 Wonewoc sandstone 735 0.2 2.12 2.32 2.65 33000331 UPH-1 Wonewoc sandstone 840 0.27 1.93 2.2 2.66 33000331 UPH-1 Mt. Simon sandstone 927 0.18 2.31 2.49 2.81…
- Question 40 In 2008, 46% of business owners gave a holiday gift to their employees. A 2009 survey of business owners indicated that 35% plan to provide a holiday gift to their employees (Radio, WEZV, Myrtle Beach, South Carolina,) Suppose the survey results are based on a sample of 60 business owners. Part A How many business owners in the survey plan to provide a holiday gift to their employees? Ans. Part B Suppose the business owners in the sample do as they plan. Compute the p-value for a hypothesis test that can be sued to determine if the proportion of business owners providing holiday gifts has decreased from the 2008 level. Part C Using a 0.05 level of…question 10 Advertising You are the marketing director for a company that manufactures bodybuilding supplements and you are planning to run ads in Magazine A and Magazine B. Based on readership data, you estimate that each one-page ad in Magazine A will be read by 575,000 people in your target group, while each one-page ad in Magazine B will be read by 275,000 people in your target group. You would like your ads to be read by at least 5 million people in the target group, and, to ensure the broadest possible audience, you would like to place at least four full-page ads in each magazine during the year. Draw the feasible region showing how many pages you can purchase in each magazine. Find the corner points of the region. (Place Magazine A on the x-axis and Magazine B on the y-axis.) Find the corner points of the region. (Order your answers from smallest to largest x, then from smallest to largest y. If an answer does not exist, enter DNE. Round each coordinate to the nearest whole…Question 23: The National Institute of Mental Health published an article stating that in any one-year period, approximately 9% of American adults suffer from depression or a depressive illness. Suppose that in a survey of 2000 people in a certain city, 10% of them suffered from depression or a depressive illness. Conduct a hypothesis test to determine if the true proportion of people in that city suffering from depression or a depressive illness is more than the 9% in the general adult American population. Test the relevant hypotheses using a 10% level of significance. Give answer to at least 4 decimal places. What are the correct hypotheses? (Select the correct symbols and use decimal values not percentages.) H0: H1: Based on the hypotheses, find the following: Test Statistic = p-value = Based on the above we choose to The correct summary would be: that the true proportion of people in that city suffering from depression or a…
- Question 1 a) The manufacturer of a gasoline additive claims that the use of this additive increases’ gasoline mileage. A random sample of 6 cars was selected, and these cars were driven for one week without the gasoline additive and then for one week with the additive. The following table gives the mileage (in miles per gallon) for these cars with and without the additive: Car 1 2 3 4 5 6 Mileage Without Additive 24.6 28.3 18.9 23.7 15.4 29.5 Mileage With Additive 26.3 31.7 18.2 25.3 18.3 30.9 Assuming mileage are normally distributed, can you conclude that the use of the gasoline additive increases mileage at the 2.5% significance level? a) Statistical significance is not the same as practical significance. Explain with an example, the stated claim. b) What general form does the alternative hypothesis take for one-way between-subjects analysis of variance? Why can’t it be summarized in a single mathematical statement?Question 3 Hermie's average 5-day natural gas usage rate is 5.9Therms5days . What are her 1-day, and 8-day, natural gas usage rates? 1.18Therms1day,7.375Therms8days 0.7375Therms1day,9.44Therms8days 1.18Therms1day,9.44Therms8days 0.7375Therms1day,7.375Therms8daysQuestion 12. Directors of a company claim that 90% of the workforce supports a new shift pattern that they have suggested. A random survey of 100 people in the workforce finds 85 in favour of the new scheme. Test if there is a significant difference between the survey results and the director's claim. 12.1 What kind of test will you perform? (a) 1 sample z-test (b) 1 sample t-test (c) 1 sample proportion t-test (d) 2 sample t-test 12.2 State the Alternative Hypothesis (a) H1: mu < 0.9 (b) H1: mu > 0.9 (c) H1: mu 0.9 (d) H1: mu 0.9