Six samples of each of four types of cereal grain grown in a certain region were analyzed to determine thiamin content, resulting in the following data (mg/g).
Six samples of each of four types of cereal grain grown in a certain region were analyzed to determine thiamin content, resulting in the following data (mg/g).

MATLAB: An Introduction with Applications
6th Edition
ISBN:9781119256830
Author:Amos Gilat
Publisher:Amos Gilat
Chapter1: Starting With Matlab
Section: Chapter Questions
Problem 1P

Related questions

Question
Transcribed Image Text:O 200% v +
T.
View
Zaam Add Page
Insert
Table
Chart
Теxt
Shape
Media Camment
Callabarate
Format Document
Document
Section
Bookmarks
Printer & Paper Size
Апу Printer
US Letter
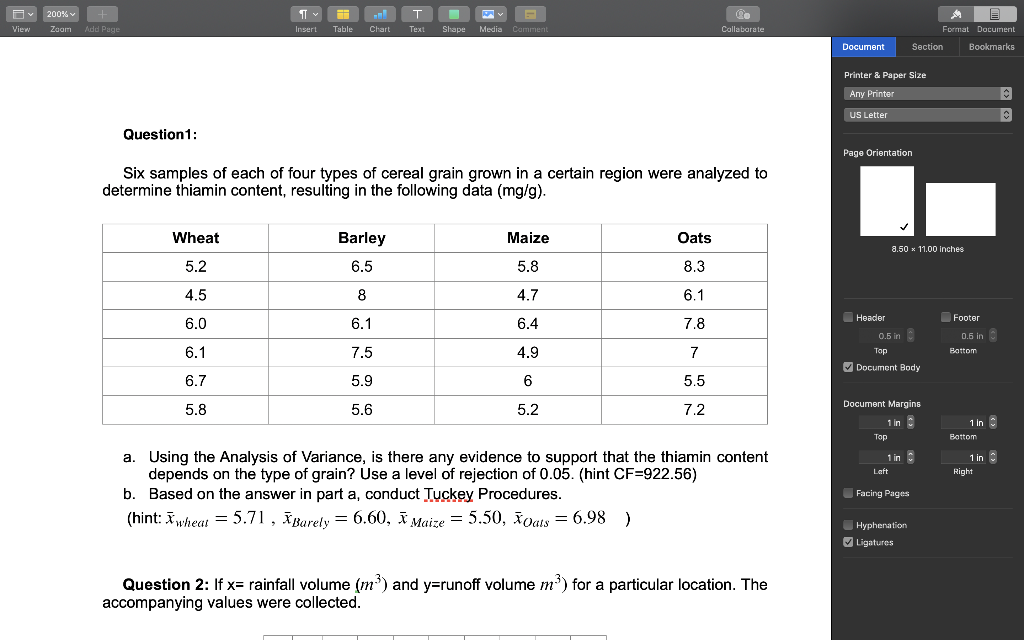
Question1:
Page Orientation
Six samples of each of four types of cereal grain grown in a certain region were analyzed to
determine thiamin content, resulting in the following data (mg/g).
Wheat
Barley
Maize
Oats
8.50 x 11.00 Inches
5.2
6.5
5.8
8.3
4.5
8
4.7
6.1
Header
OFooter
6.0
6.1
6.4
7.8
0.5 in
0.6 in
6.1
7.5
4.9
7
Top
Bottom
V Document Body
6.7
5.9
6
5.5
Document Margins
5.8
5.6
5.2
7.2
1 in
1 in :
Top
Battom
1 in :
a. Using the Analysis of Variance, is there any evidence to support that the thiamin content
depends on the type of grain? Use a level of rejection of 0.05. (hint CF=922.56)
1 in :
Laft
Right
b. Based on the answer in part a, conduct Tuckey Procedures.
Facing Pages
(hint: wheat = 5.71 , īBarety = 6.60, ī Maize = 5.50, xoats = 6.98 )
UHyphenation
V Ligatures
Question 2: If x= rainfall volume (m) and y=runoff volume m) for a particular location. The
accompanying values were collected.
Expert Solution
This question has been solved!
Explore an expertly crafted, step-by-step solution for a thorough understanding of key concepts.

This is a popular solution!

Trending now
This is a popular solution!

Step by step
Solved in 3 steps with 3 images

Knowledge Booster


Learn more about
Need a deep-dive on the concept behind this application? Look no further. Learn more about this topic, statistics and related others by exploring similar questions and additional content below.Recommended textbooks for you
MATLAB: An Introduction with Applications
Statistics
ISBN:
9781119256830
Author:
Amos Gilat
Publisher:
John Wiley & Sons Inc

Probability and Statistics for Engineering and th…
Statistics
ISBN:
9781305251809
Author:
Jay L. Devore
Publisher:
Cengage Learning

Statistics for The Behavioral Sciences (MindTap C…
Statistics
ISBN:
9781305504912
Author:
Frederick J Gravetter, Larry B. Wallnau
Publisher:
Cengage Learning
MATLAB: An Introduction with Applications
Statistics
ISBN:
9781119256830
Author:
Amos Gilat
Publisher:
John Wiley & Sons Inc
Probability and Statistics for Engineering and th…
Statistics
ISBN:
9781305251809
Author:
Jay L. Devore
Publisher:
Cengage Learning
Statistics for The Behavioral Sciences (MindTap C…
Statistics
ISBN:
9781305504912
Author:
Frederick J Gravetter, Larry B. Wallnau
Publisher:
Cengage Learning

Elementary Statistics: Picturing the World (7th E…
Statistics
ISBN:
9780134683416
Author:
Ron Larson, Betsy Farber
Publisher:
PEARSON

The Basic Practice of Statistics
Statistics
ISBN:
9781319042578
Author:
David S. Moore, William I. Notz, Michael A. Fligner
Publisher:
W. H. Freeman

Introduction to the Practice of Statistics
Statistics
ISBN:
9781319013387
Author:
David S. Moore, George P. McCabe, Bruce A. Craig
Publisher:
W. H. Freeman