10 Problem Set: Chapter 14 Correlation and Regression Suppose a graduate student does a survey of undergraduate study habits on his university campus. He collects data on students who are in different years in college by asking them how many hours of course work they do for each class in a typical week. A sample of four students provides the following data on year in college and hours of course work per dass: Student Year in College Course Work Hours per Class Freshman (1) 8. Sophomore (2) Junior (3) 3. 5. Senior (4) 4. 51 A scatter plot of the sample data is shown here (blue circle symbols). The line Y = -2X + 10 is shown in orange. 0 Sum of Distances Type here to search R. 962&elSBN=9780357035542&id%3D1 YouTube Maps M Gmail sdep, Translate sd SMƏ CENGAGE MINDTAP Problem Set: Chapter 14 Correlation and Regression Think about how dose the line Y = -2X+ 10 is to the sample points. Look at the graph and find each point's vertical distance from the line. If the point sits above the line, the distance is positive; if the point sits below the line, the distance is negative. The sum of the vertical distances between the sample points and the orange line is , and the sum of the squared vertical distances between the sample points and the orange line is On the graph, place the black point (X symbol) on the gràph to plot the point (Mx, My), where Mx is the mean year for the four students (1, 2, 3, and 4) in the sample and My is the mean hours of course work per cdass for the four students (8, 6, 5, and 5) in the sample. Then use the green line (triangle symbols) to plot the line that has the same slope as (is parallel to) the line Y = -2X + 10, but with the additional property that the vertical distances between the points and the line sum to 0. To plot the line, drag the green line onto the graph. Move the green triangles to adjust the slope. The line you just plotted through the point (Mx, My). The sum of the squared vertical distances between the sample points and the line that you just plotted is Which of the following describes the plotted line with the smallest total squared error? OY = -2X + 10 O The line you plotted that has a sum of the distances equal to 0 O Neither-the two lines fit the data equally well Suppose you fit the regression line to the four sample points on the graph. On the basis of your work so far, being as specific as you can be, you know that the total squared error is Type here to search dp
10 Problem Set: Chapter 14 Correlation and Regression Suppose a graduate student does a survey of undergraduate study habits on his university campus. He collects data on students who are in different years in college by asking them how many hours of course work they do for each class in a typical week. A sample of four students provides the following data on year in college and hours of course work per dass: Student Year in College Course Work Hours per Class Freshman (1) 8. Sophomore (2) Junior (3) 3. 5. Senior (4) 4. 51 A scatter plot of the sample data is shown here (blue circle symbols). The line Y = -2X + 10 is shown in orange. 0 Sum of Distances Type here to search R. 962&elSBN=9780357035542&id%3D1 YouTube Maps M Gmail sdep, Translate sd SMƏ CENGAGE MINDTAP Problem Set: Chapter 14 Correlation and Regression Think about how dose the line Y = -2X+ 10 is to the sample points. Look at the graph and find each point's vertical distance from the line. If the point sits above the line, the distance is positive; if the point sits below the line, the distance is negative. The sum of the vertical distances between the sample points and the orange line is , and the sum of the squared vertical distances between the sample points and the orange line is On the graph, place the black point (X symbol) on the gràph to plot the point (Mx, My), where Mx is the mean year for the four students (1, 2, 3, and 4) in the sample and My is the mean hours of course work per cdass for the four students (8, 6, 5, and 5) in the sample. Then use the green line (triangle symbols) to plot the line that has the same slope as (is parallel to) the line Y = -2X + 10, but with the additional property that the vertical distances between the points and the line sum to 0. To plot the line, drag the green line onto the graph. Move the green triangles to adjust the slope. The line you just plotted through the point (Mx, My). The sum of the squared vertical distances between the sample points and the line that you just plotted is Which of the following describes the plotted line with the smallest total squared error? OY = -2X + 10 O The line you plotted that has a sum of the distances equal to 0 O Neither-the two lines fit the data equally well Suppose you fit the regression line to the four sample points on the graph. On the basis of your work so far, being as specific as you can be, you know that the total squared error is Type here to search dp

Functions and Change: A Modeling Approach to College Algebra (MindTap Course List)
6th Edition
ISBN:9781337111348
Author:Bruce Crauder, Benny Evans, Alan Noell
Publisher:Bruce Crauder, Benny Evans, Alan Noell
Chapter5: A Survey Of Other Common Functions
Section5.3: Modeling Data With Power Functions
Problem 6E: Urban Travel Times Population of cities and driving times are related, as shown in the accompanying...

Related questions
Question
Linear equations and the regression line
Transcribed Image Text:10
Problem Set: Chapter 14 Correlation and Regression
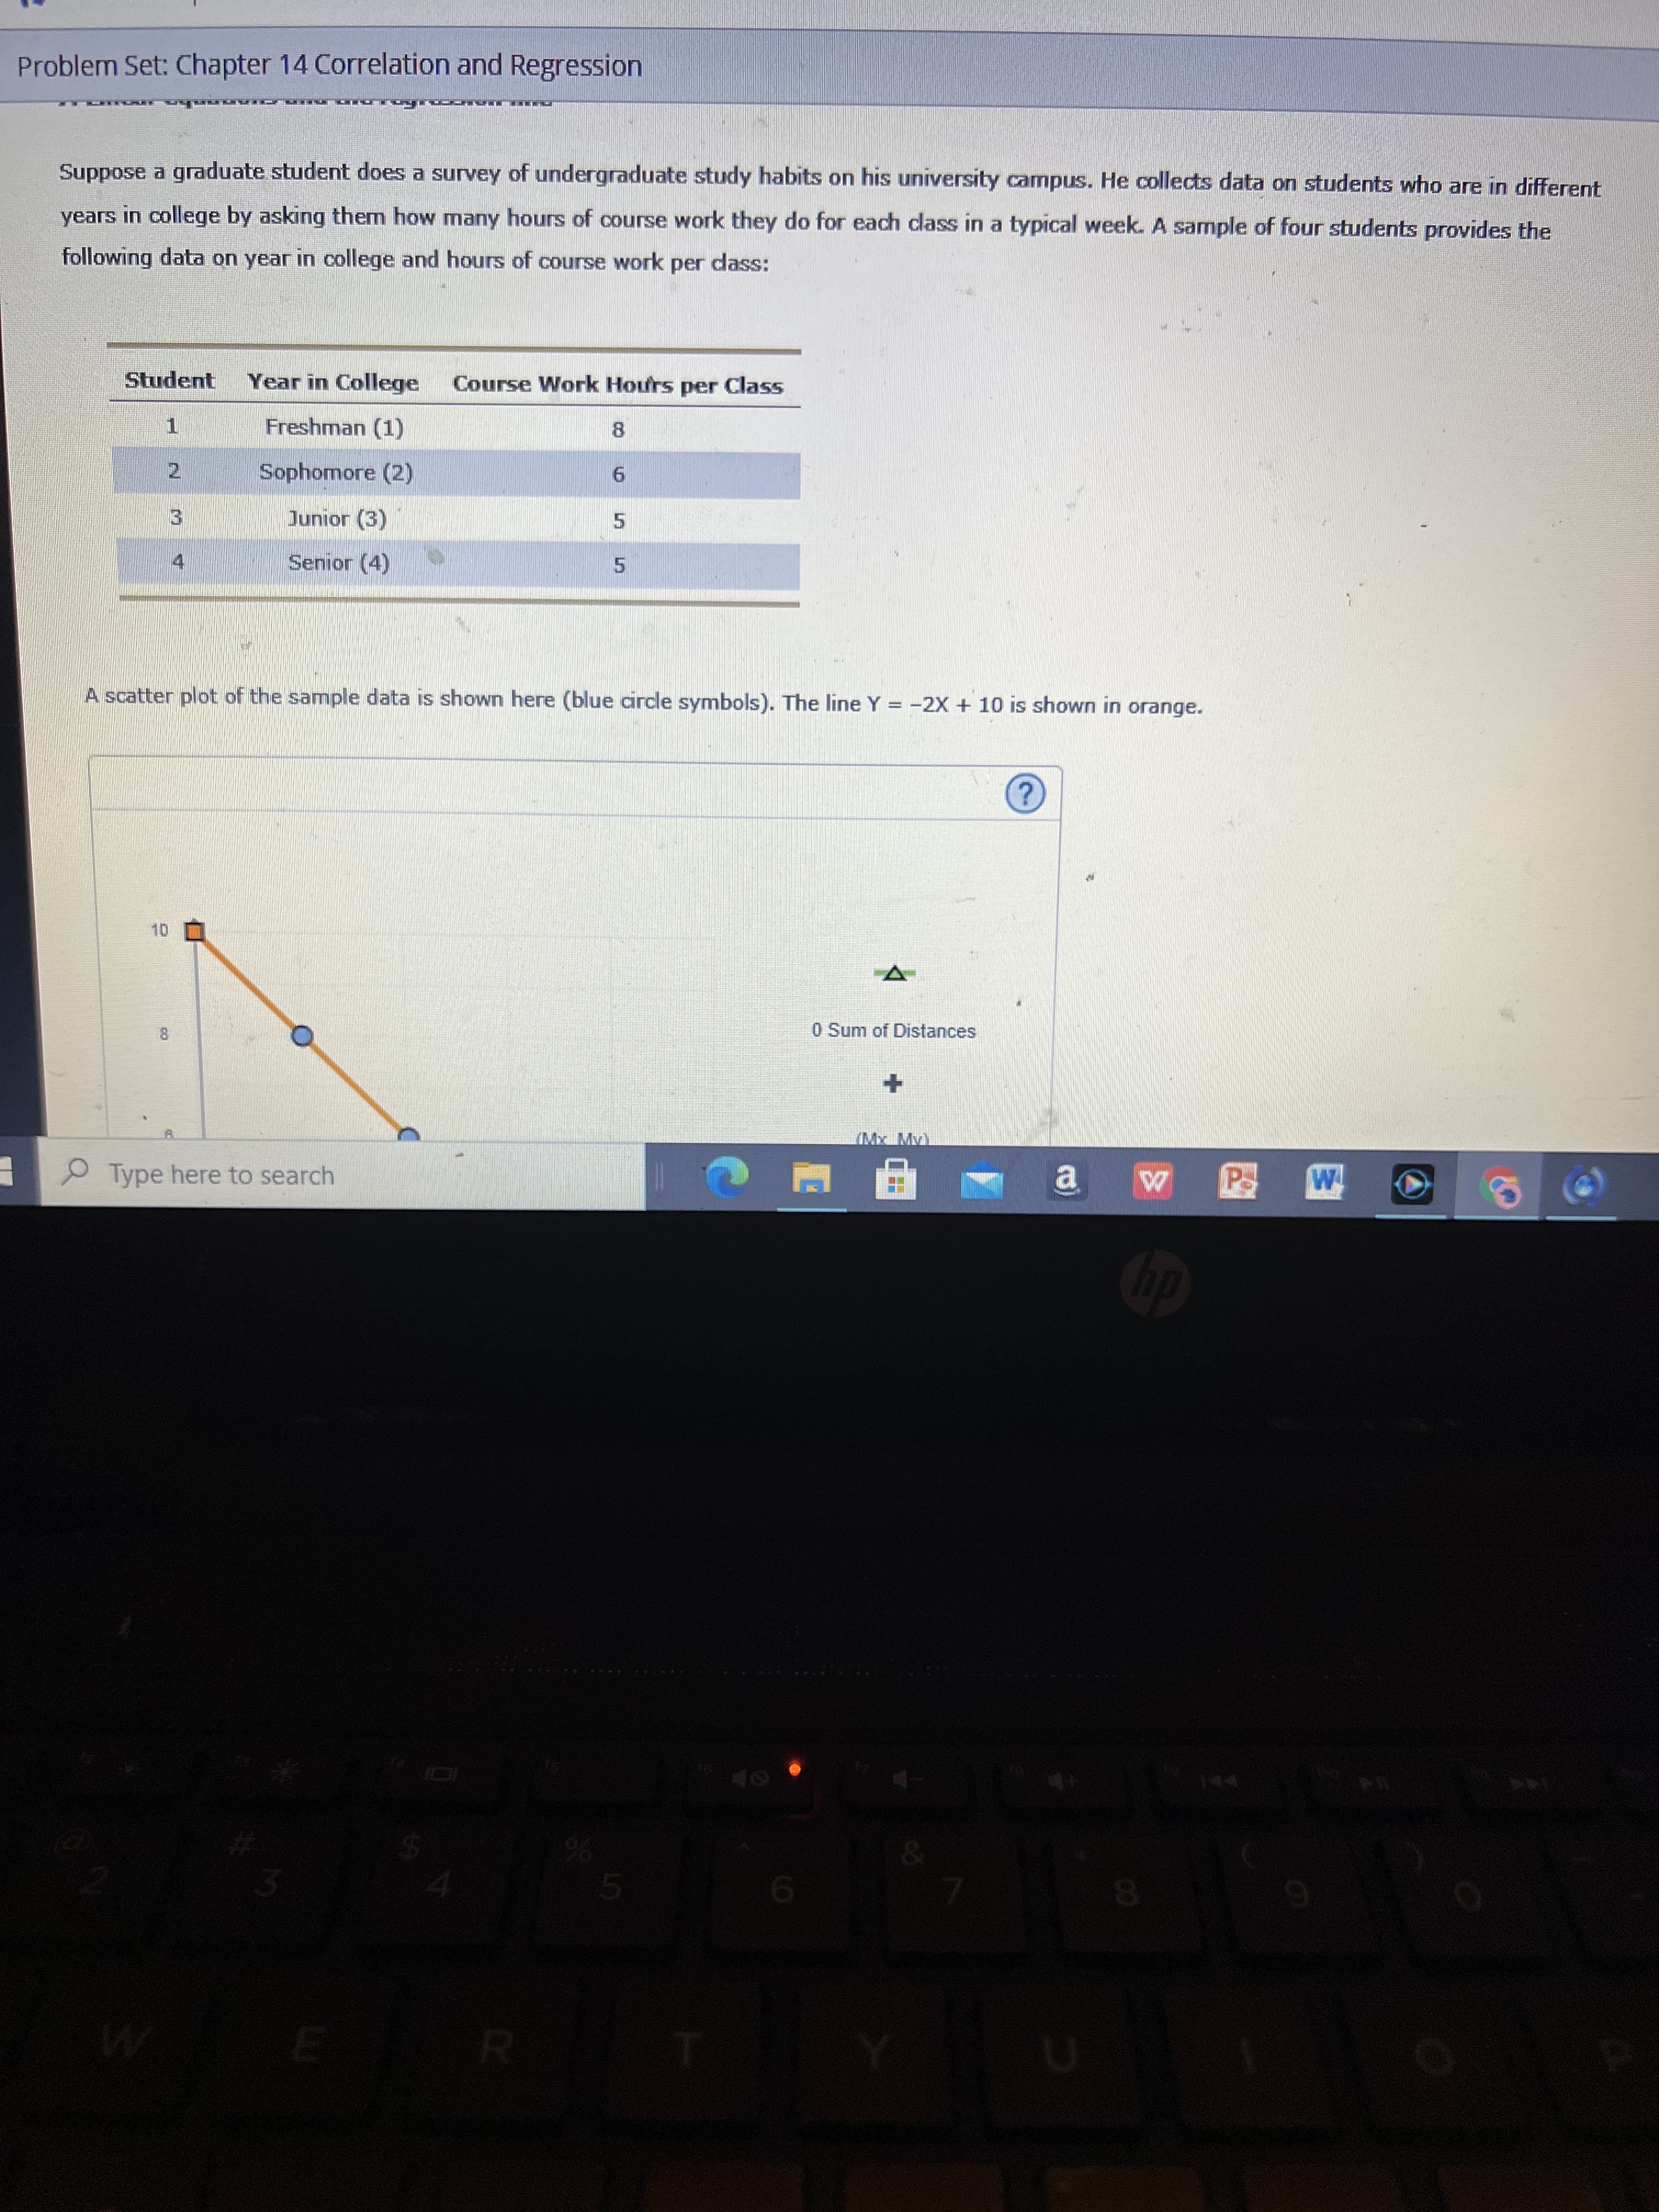
Suppose a graduate student does a survey of undergraduate study habits on his university campus. He collects data on students who are in different
years in college by asking them how many hours of course work they do for each class in a typical week. A sample of four students provides the
following data on year in college and hours of course work per dass:
Student
Year in College
Course Work Hours per Class
Freshman (1)
8.
Sophomore (2)
Junior (3)
3.
5.
Senior (4)
4.
51
A scatter plot of the sample data is shown here (blue circle symbols). The line Y = -2X + 10 is shown in orange.
0 Sum of Distances
Type here to search
R.
Transcribed Image Text:962&elSBN=9780357035542&id%3D1
YouTube
Maps M Gmail
sdep,
Translate
sd
SMƏ
CENGAGE MINDTAP
Problem Set: Chapter 14 Correlation and Regression
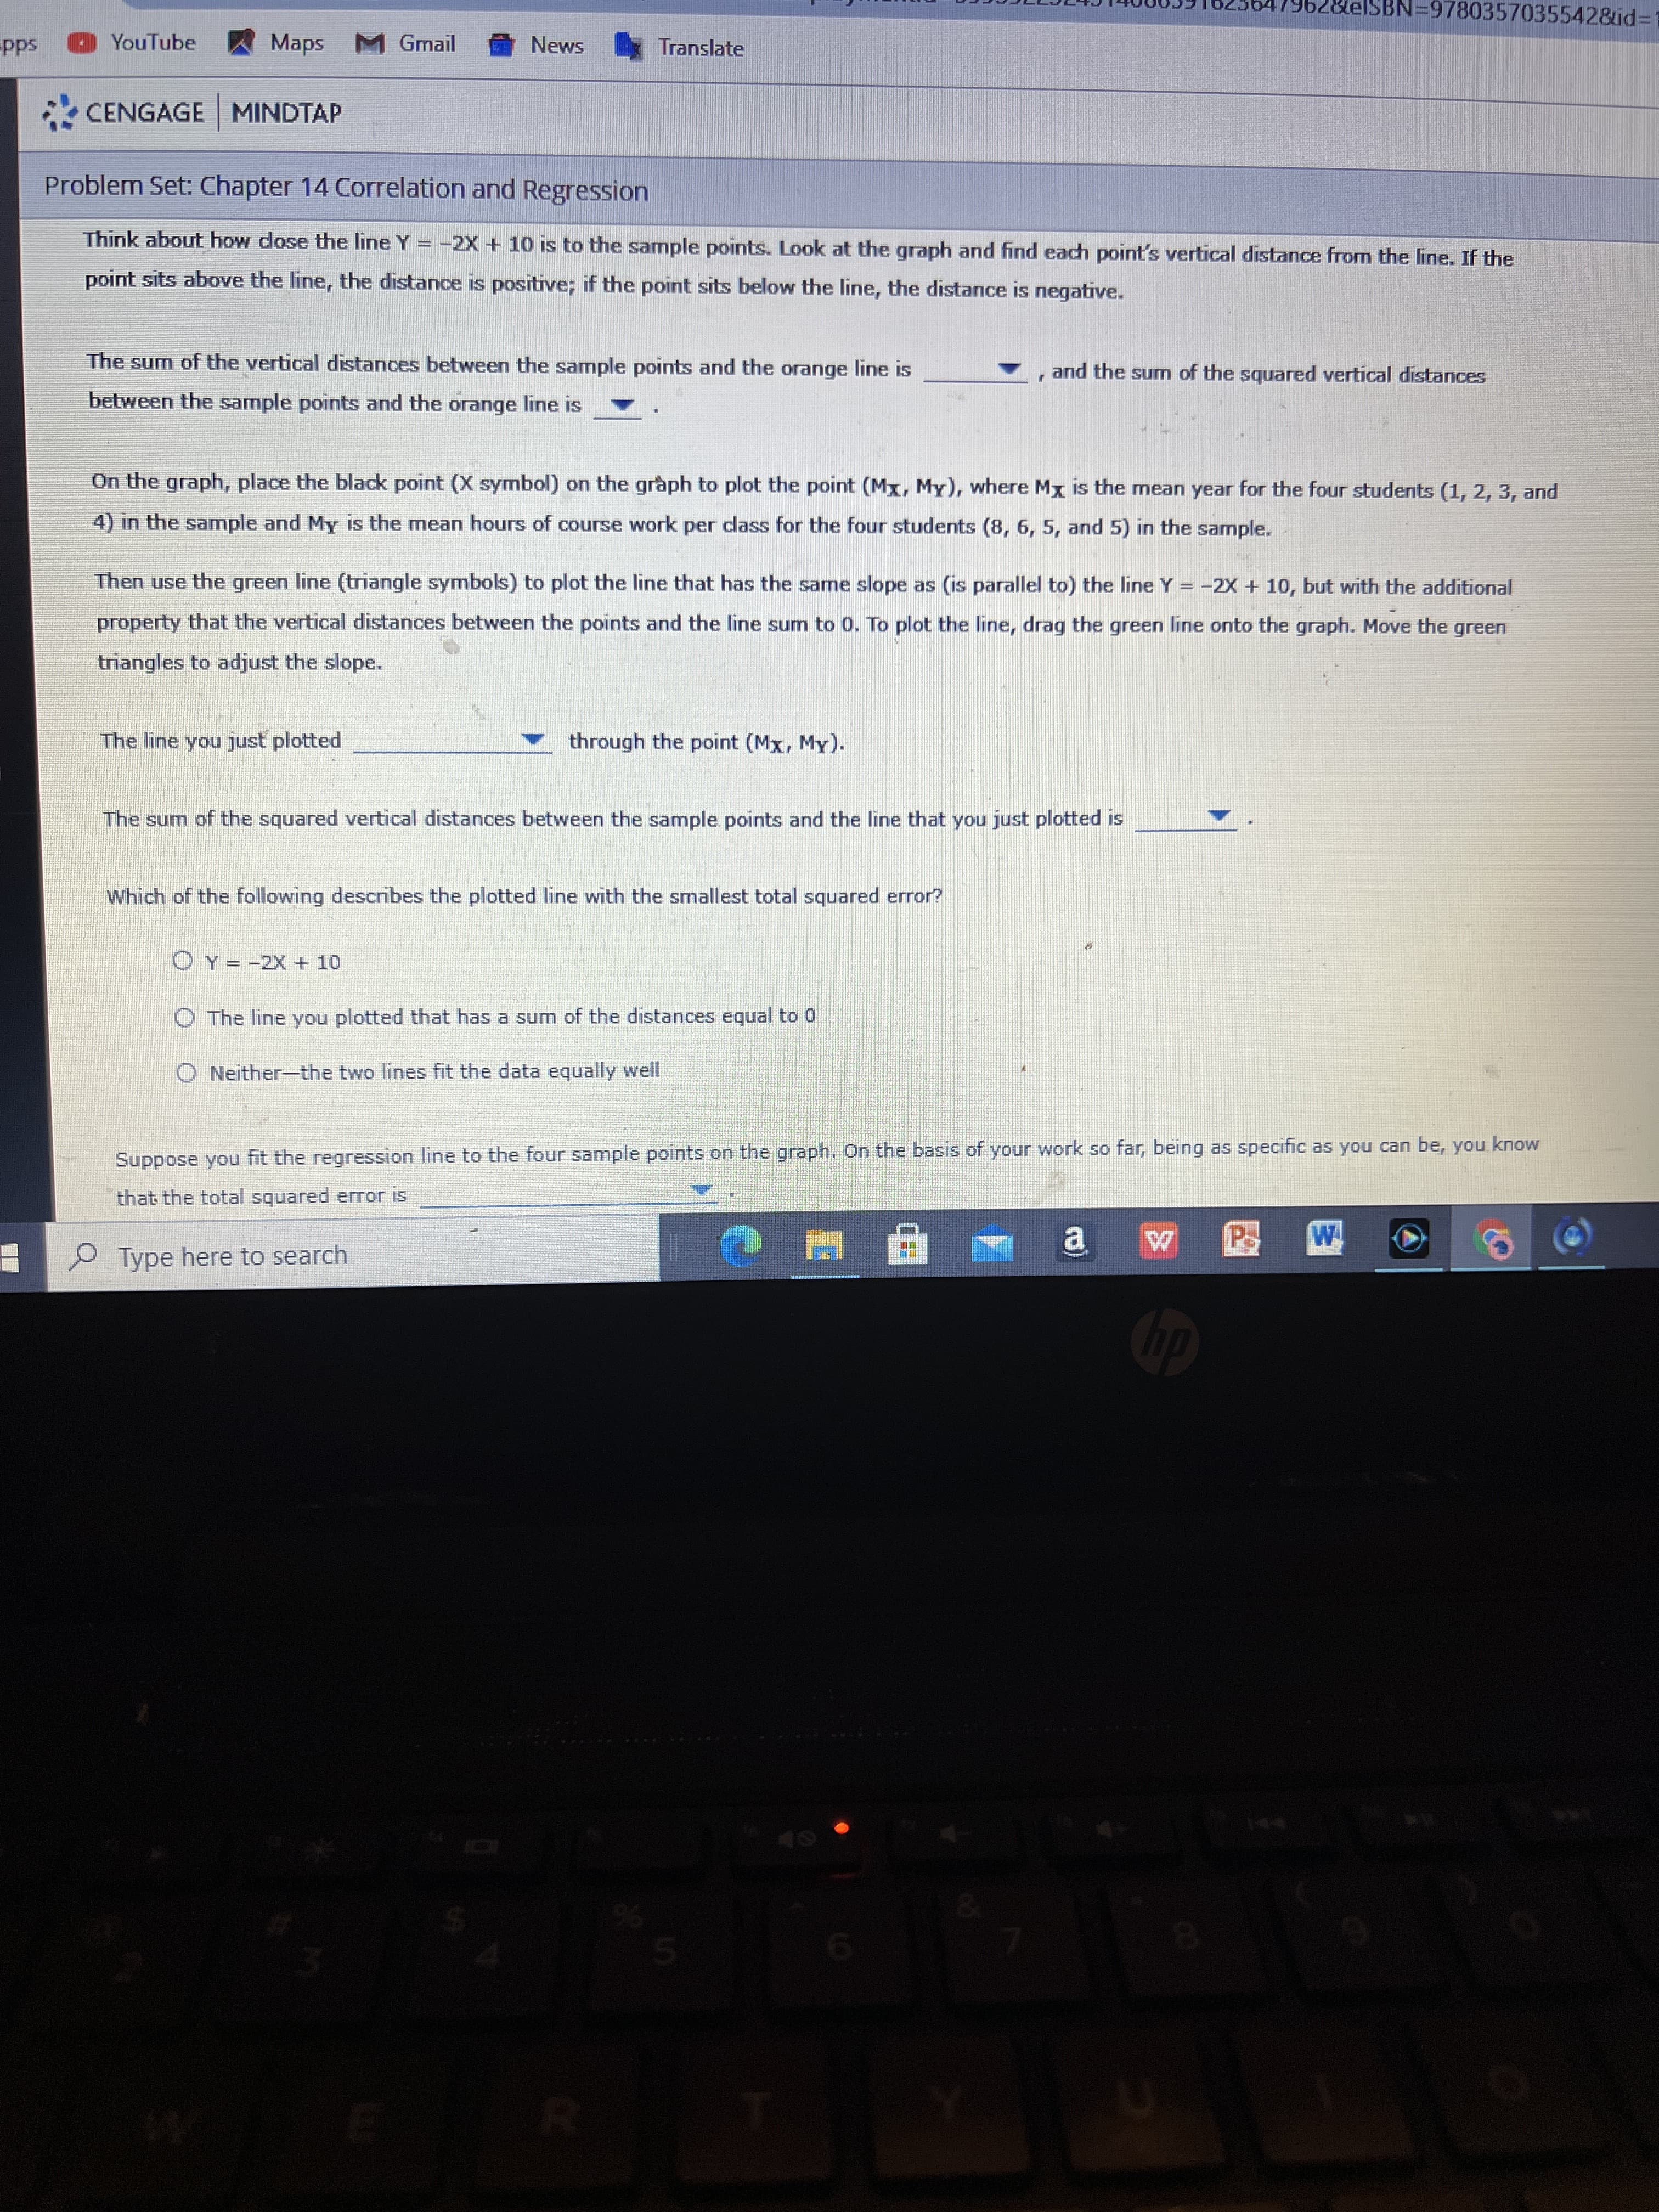
Think about how dose the line Y = -2X+ 10 is to the sample points. Look at the graph and find each point's vertical distance from the line. If the
point sits above the line, the distance is positive; if the point sits below the line, the distance is negative.
The sum of the vertical distances between the sample points and the orange line is
, and the sum of the squared vertical distances
between the sample points and the orange line is
On the graph, place the black point (X symbol) on the gràph to plot the point (Mx, My), where Mx is the mean year for the four students (1, 2, 3, and
4) in the sample and My is the mean hours of course work per cdass for the four students (8, 6, 5, and 5) in the sample.
Then use the green line (triangle symbols) to plot the line that has the same slope as (is parallel to) the line Y = -2X + 10, but with the additional
property that the vertical distances between the points and the line sum to 0. To plot the line, drag the green line onto the graph. Move the green
triangles to adjust the slope.
The line you just plotted
through the point (Mx, My).
The sum of the squared vertical distances between the sample points and the line that you just plotted is
Which of the following describes the plotted line with the smallest total squared error?
OY = -2X + 10
O The line you plotted that has a sum of the distances equal to 0
O Neither-the two lines fit the data equally well
Suppose you fit the regression line to the four sample points on the graph. On the basis of your work so far, being as specific as you can be, you know
that the total squared error is
Type here to search
dp
Expert Solution
This question has been solved!
Explore an expertly crafted, step-by-step solution for a thorough understanding of key concepts.

This is a popular solution!

Trending now
This is a popular solution!

Step by step
Solved in 3 steps with 3 images

Recommended textbooks for you
Functions and Change: A Modeling Approach to Coll…
Algebra
ISBN:
9781337111348
Author:
Bruce Crauder, Benny Evans, Alan Noell
Publisher:
Cengage Learning

Glencoe Algebra 1, Student Edition, 9780079039897…
Algebra
ISBN:
9780079039897
Author:
Carter
Publisher:
McGraw Hill

Big Ideas Math A Bridge To Success Algebra 1: Stu…
Algebra
ISBN:
9781680331141
Author:
HOUGHTON MIFFLIN HARCOURT
Publisher:
Houghton Mifflin Harcourt
Functions and Change: A Modeling Approach to Coll…
Algebra
ISBN:
9781337111348
Author:
Bruce Crauder, Benny Evans, Alan Noell
Publisher:
Cengage Learning
Glencoe Algebra 1, Student Edition, 9780079039897…
Algebra
ISBN:
9780079039897
Author:
Carter
Publisher:
McGraw Hill
Big Ideas Math A Bridge To Success Algebra 1: Stu…
Algebra
ISBN:
9781680331141
Author:
HOUGHTON MIFFLIN HARCOURT
Publisher:
Houghton Mifflin Harcourt