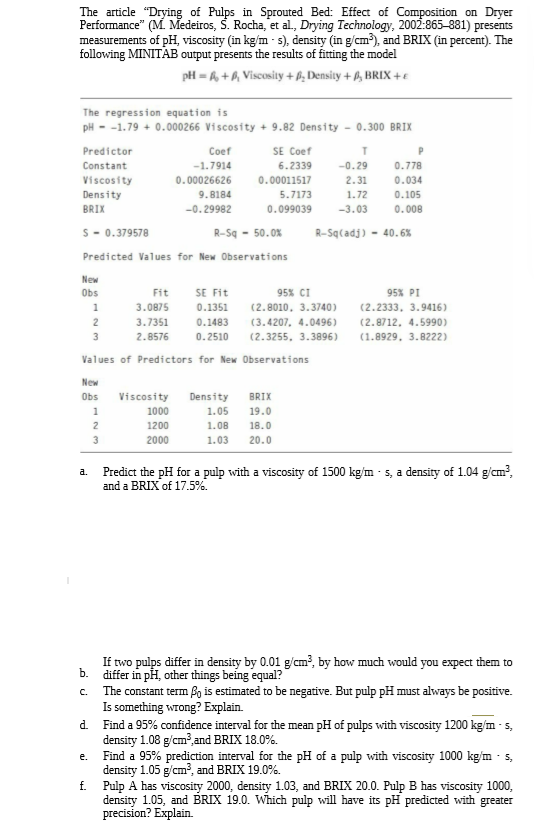
The article "Drying of Pulps in Sprouted Bed: Effect of Composition on Dryer Performance" (M. Medeiros, S. Rocha, et al., Drying Technology, 2002:865-881) presents measurements of pH, viscosity (in kg/m - s), density (in g/cm), and BRIX (in percent). The following MINITAB output presents the results of fitting the model pH = 6, +6, Viscosity + B, Density + ß, BRIX +€ The regression equation is pH - -1.79 + 0.000266 Viscosity + 9.82 Density - 0.300 BRIX Predictor Coef SE Coef Constant -1.7914 6.2339 -0.29 0.778 Viscosity 0.00026626 0.00011517 2.31 0.034 Density 9.8184 5.7173 1.72 0.105 BRIX -0.29982 0.099039 -3.03 0.008 S - 0.379578 R-Sq - 50.0% R-Sq(adj) - 40.6% Predicted Values for New Observations New Obs Fit SE Fit 95% CI 95% PI 3.0875 0.1351 (2.8010, 3.3740) (2.2333, 3.9416) (3.4207, 4.0496) (2.3255, 3.3896) 2 3.7351 0.1483 (2.8712, 4.5990) з 2.8576 0.2510 (1.8929, 3.8222) Values of Predictors for New Observations New Obs Viscosity Density BRIX 1000 1.05 19.0 1200 1.08 18.0 2000 1.03 20.0 Predict the pH for a pulp with a viscosity of 1500 kg/m - s, a density of 1.04 g/cm?, and a BRIX of 17.5%. a. If two pulps differ in density by 0.01 g/cm², by how much would you expect them to differ in pH, other things being equal? ъ. The constant term Bo is estimated to be negative. But pulp pH must always be positive. Is something wrong? Explain. Find a 95% confidence interval for the mean pH of pulps with viscosity 1200 kg/m - s, density 1.08 g/cm³,and BRIX 18.0%. Find a 95% prediction interval for the pH of a pulp with viscosity 1000 kg/m - s, density 1.05 g/cm?, and BRIX 19.0%. f. Pulp A has viscosity 2000, density 1.03, and BRIX 20.0. Pulp B has viscosity 1000, density 1.05, and BRIX 19.0. Which pulp will have its pH predicted with greater precision? Explain. C. d. e.
The article "Drying of Pulps in Sprouted Bed: Effect of Composition on Dryer Performance" (M. Medeiros, S. Rocha, et al., Drying Technology, 2002:865-881) presents measurements of pH, viscosity (in kg/m - s), density (in g/cm), and BRIX (in percent). The following MINITAB output presents the results of fitting the model pH = 6, +6, Viscosity + B, Density + ß, BRIX +€ The regression equation is pH - -1.79 + 0.000266 Viscosity + 9.82 Density - 0.300 BRIX Predictor Coef SE Coef Constant -1.7914 6.2339 -0.29 0.778 Viscosity 0.00026626 0.00011517 2.31 0.034 Density 9.8184 5.7173 1.72 0.105 BRIX -0.29982 0.099039 -3.03 0.008 S - 0.379578 R-Sq - 50.0% R-Sq(adj) - 40.6% Predicted Values for New Observations New Obs Fit SE Fit 95% CI 95% PI 3.0875 0.1351 (2.8010, 3.3740) (2.2333, 3.9416) (3.4207, 4.0496) (2.3255, 3.3896) 2 3.7351 0.1483 (2.8712, 4.5990) з 2.8576 0.2510 (1.8929, 3.8222) Values of Predictors for New Observations New Obs Viscosity Density BRIX 1000 1.05 19.0 1200 1.08 18.0 2000 1.03 20.0 Predict the pH for a pulp with a viscosity of 1500 kg/m - s, a density of 1.04 g/cm?, and a BRIX of 17.5%. a. If two pulps differ in density by 0.01 g/cm², by how much would you expect them to differ in pH, other things being equal? ъ. The constant term Bo is estimated to be negative. But pulp pH must always be positive. Is something wrong? Explain. Find a 95% confidence interval for the mean pH of pulps with viscosity 1200 kg/m - s, density 1.08 g/cm³,and BRIX 18.0%. Find a 95% prediction interval for the pH of a pulp with viscosity 1000 kg/m - s, density 1.05 g/cm?, and BRIX 19.0%. f. Pulp A has viscosity 2000, density 1.03, and BRIX 20.0. Pulp B has viscosity 1000, density 1.05, and BRIX 19.0. Which pulp will have its pH predicted with greater precision? Explain. C. d. e.

MATLAB: An Introduction with Applications
6th Edition
ISBN:9781119256830
Author:Amos Gilat
Publisher:Amos Gilat
Chapter1: Starting With Matlab
Section: Chapter Questions
Problem 1P

Related questions
Question
Transcribed Image Text:The article "Drying of Pulps in Sprouted Bed: Effect of Composition on Dryer
Performance" (M. Medeiros, S. Rocha, et al., Drying Technology, 2002:865-881) presents
measurements of pH, viscosity (in kg/m - s), density (in g/cm), and BRIX (in percent). The
following MINITAB output presents the results of fitting the model
pH = 6, +6, Viscosity + B, Density + ß, BRIX +€
The regression equation is
pH - -1.79 + 0.000266 Viscosity + 9.82 Density - 0.300 BRIX
Predictor
Coef
SE Coef
Constant
-1.7914
6.2339
-0.29
0.778
Viscosity
0.00026626
0.00011517
2.31
0.034
Density
9.8184
5.7173
1.72
0.105
BRIX
-0.29982
0.099039
-3.03
0.008
S - 0.379578
R-Sq - 50.0%
R-Sq(adj) - 40.6%
Predicted Values for New Observations
New
Obs
Fit
SE Fit
95% CI
95% PI
3.0875
0.1351
(2.8010, 3.3740)
(2.2333, 3.9416)
(3.4207, 4.0496)
(2.3255, 3.3896)
2
3.7351
0.1483
(2.8712, 4.5990)
з
2.8576
0.2510
(1.8929, 3.8222)
Values of Predictors for New Observations
New
Obs
Viscosity
Density
BRIX
1000
1.05
19.0
1200
1.08
18.0
2000
1.03
20.0
Predict the pH for a pulp with a viscosity of 1500 kg/m - s, a density of 1.04 g/cm?,
and a BRIX of 17.5%.
a.
If two pulps differ in density by 0.01 g/cm², by how much would you expect them to
differ in pH, other things being equal?
ъ.
The constant term Bo is estimated to be negative. But pulp pH must always be positive.
Is something wrong? Explain.
Find a 95% confidence interval for the mean pH of pulps with viscosity 1200 kg/m - s,
density 1.08 g/cm³,and BRIX 18.0%.
Find a 95% prediction interval for the pH of a pulp with viscosity 1000 kg/m - s,
density 1.05 g/cm?, and BRIX 19.0%.
f. Pulp A has viscosity 2000, density 1.03, and BRIX 20.0. Pulp B has viscosity 1000,
density 1.05, and BRIX 19.0. Which pulp will have its pH predicted with greater
precision? Explain.
C.
d.
e.
Expert Solution
This question has been solved!
Explore an expertly crafted, step-by-step solution for a thorough understanding of key concepts.

This is a popular solution!

Trending now
This is a popular solution!

Step by step
Solved in 4 steps

Recommended textbooks for you
MATLAB: An Introduction with Applications
Statistics
ISBN:
9781119256830
Author:
Amos Gilat
Publisher:
John Wiley & Sons Inc

Probability and Statistics for Engineering and th…
Statistics
ISBN:
9781305251809
Author:
Jay L. Devore
Publisher:
Cengage Learning

Statistics for The Behavioral Sciences (MindTap C…
Statistics
ISBN:
9781305504912
Author:
Frederick J Gravetter, Larry B. Wallnau
Publisher:
Cengage Learning
MATLAB: An Introduction with Applications
Statistics
ISBN:
9781119256830
Author:
Amos Gilat
Publisher:
John Wiley & Sons Inc
Probability and Statistics for Engineering and th…
Statistics
ISBN:
9781305251809
Author:
Jay L. Devore
Publisher:
Cengage Learning
Statistics for The Behavioral Sciences (MindTap C…
Statistics
ISBN:
9781305504912
Author:
Frederick J Gravetter, Larry B. Wallnau
Publisher:
Cengage Learning

Elementary Statistics: Picturing the World (7th E…
Statistics
ISBN:
9780134683416
Author:
Ron Larson, Betsy Farber
Publisher:
PEARSON

The Basic Practice of Statistics
Statistics
ISBN:
9781319042578
Author:
David S. Moore, William I. Notz, Michael A. Fligner
Publisher:
W. H. Freeman

Introduction to the Practice of Statistics
Statistics
ISBN:
9781319013387
Author:
David S. Moore, George P. McCabe, Bruce A. Craig
Publisher:
W. H. Freeman