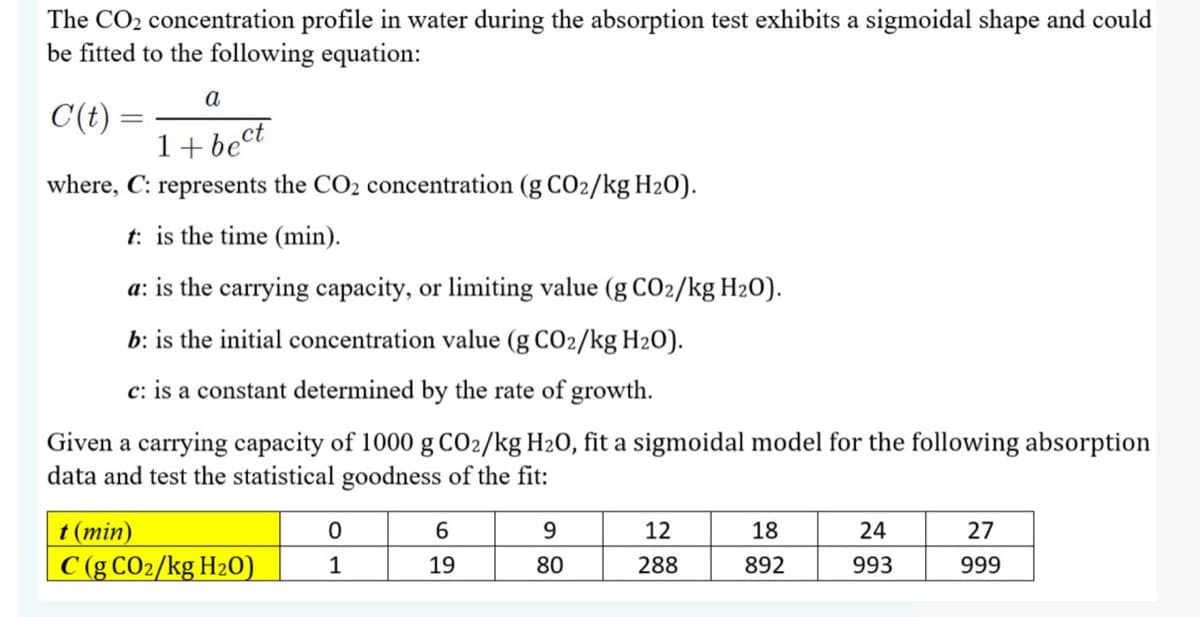
The CO2 concentration profile in water during the absorption test exhibits a sigmoidal shape and could be fitted to the following equation: a C(t) 1+ bect |3D where, C: represents the CO2 concentration (g CO2/kg H20). t: is the time (min). a: is the carrying capacity, or limiting value (g CO2/kg H2O). b: is the initial concentration value (g CO2/kg H2O). c: is a constant determined by the rate of growth. Given a carrying capacity of 1000 g CO2/kg H20, fit a sigmoidal model for the following absorption data and test the statistical goodness of the fit:
The CO2 concentration profile in water during the absorption test exhibits a sigmoidal shape and could be fitted to the following equation: a C(t) 1+ bect |3D where, C: represents the CO2 concentration (g CO2/kg H20). t: is the time (min). a: is the carrying capacity, or limiting value (g CO2/kg H2O). b: is the initial concentration value (g CO2/kg H2O). c: is a constant determined by the rate of growth. Given a carrying capacity of 1000 g CO2/kg H20, fit a sigmoidal model for the following absorption data and test the statistical goodness of the fit:

Principles of Instrumental Analysis
7th Edition
ISBN:9781305577213
Author:Douglas A. Skoog, F. James Holler, Stanley R. Crouch
Publisher:Douglas A. Skoog, F. James Holler, Stanley R. Crouch
Chapter14: Applications Of Ultraviolet-visible Molecular Absorption Spectrometry
Section: Chapter Questions
Problem 14.12QAP

Related questions
Question
Transcribed Image Text:The CO2 concentration profile in water during the absorption test exhibits a sigmoidal shape and could
be fitted to the following equation:
a
C(t) =
1+bect
where, C: represents the CO2 concentration (g CO2/kg H2O).
t: is the time (min).
a: is the carrying capacity, or limiting value (g CO2/kg H20).
b: is the initial concentration value (g CO2/kg H2O).
c: is a constant determined by the rate of growth.
Given a carrying capacity of 1000 g CO2/kg H20, fit a sigmoidal model for the following absorption
data and test the statistical goodness of the fit:
t (min)
C (g CO2/kg H2O)
6.
9.
12
18
24
27
1
19
80
288
892
993
999
Expert Solution
This question has been solved!
Explore an expertly crafted, step-by-step solution for a thorough understanding of key concepts.

This is a popular solution!

Trending now
This is a popular solution!

Step by step
Solved in 3 steps with 5 images

Knowledge Booster


Learn more about
Need a deep-dive on the concept behind this application? Look no further. Learn more about this topic, chemistry and related others by exploring similar questions and additional content below.Recommended textbooks for you
Principles of Instrumental Analysis
Chemistry
ISBN:
9781305577213
Author:
Douglas A. Skoog, F. James Holler, Stanley R. Crouch
Publisher:
Cengage Learning

Principles of Instrumental Analysis
Chemistry
ISBN:
9781305577213
Author:
Douglas A. Skoog, F. James Holler, Stanley R. Crouch
Publisher:
Cengage Learning