The data in the following table compared women who viewed television violence with those who did not, in order to study the differences in physical abuse of the spouse. Use the output to test whether television violence and abusiveness are associated, using a significance level of 0.05. High TV Violence Low TV Violence Yes, Physical Abuse 12 30 No Physical Abuse 23 111 Chi-Square Test: High TV Violence, Low TV Violence Expected counts are printed below observed counts Chi-Square contributions are printed below expected counts High TV Low TV Violence violence Total Yes, ab 12 30 42 8.35 33.65 1.593 0.395 No 23 111 134 26.65 107.35 0.499 0.124 Total 35 141 176 Chi-Sq - 2.612, DF = 1, P-Value - 0.106 NOTE: in the boxed-in table, observed values are given first, then expected counts, then the chi-square contribution. From this data, answer the following: a) state the hypotheses for a chi-square test b) is this a test of independence or homogeneity? How do you know? a What conclusion can he drawn based on the give n-value and a significance. level.
The data in the following table compared women who viewed television violence with those who did not, in order to study the differences in physical abuse of the spouse. Use the output to test whether television violence and abusiveness are associated, using a significance level of 0.05. High TV Violence Low TV Violence Yes, Physical Abuse 12 30 No Physical Abuse 23 111 Chi-Square Test: High TV Violence, Low TV Violence Expected counts are printed below observed counts Chi-Square contributions are printed below expected counts High TV Low TV Violence violence Total Yes, ab 12 30 42 8.35 33.65 1.593 0.395 No 23 111 134 26.65 107.35 0.499 0.124 Total 35 141 176 Chi-Sq - 2.612, DF = 1, P-Value - 0.106 NOTE: in the boxed-in table, observed values are given first, then expected counts, then the chi-square contribution. From this data, answer the following: a) state the hypotheses for a chi-square test b) is this a test of independence or homogeneity? How do you know? a What conclusion can he drawn based on the give n-value and a significance. level.

Glencoe Algebra 1, Student Edition, 9780079039897, 0079039898, 2018
18th Edition
ISBN:9780079039897
Author:Carter
Publisher:Carter
Chapter10: Statistics
Section10.4: Distributions Of Data
Problem 19PFA

Related questions
Question
Need help with a-c
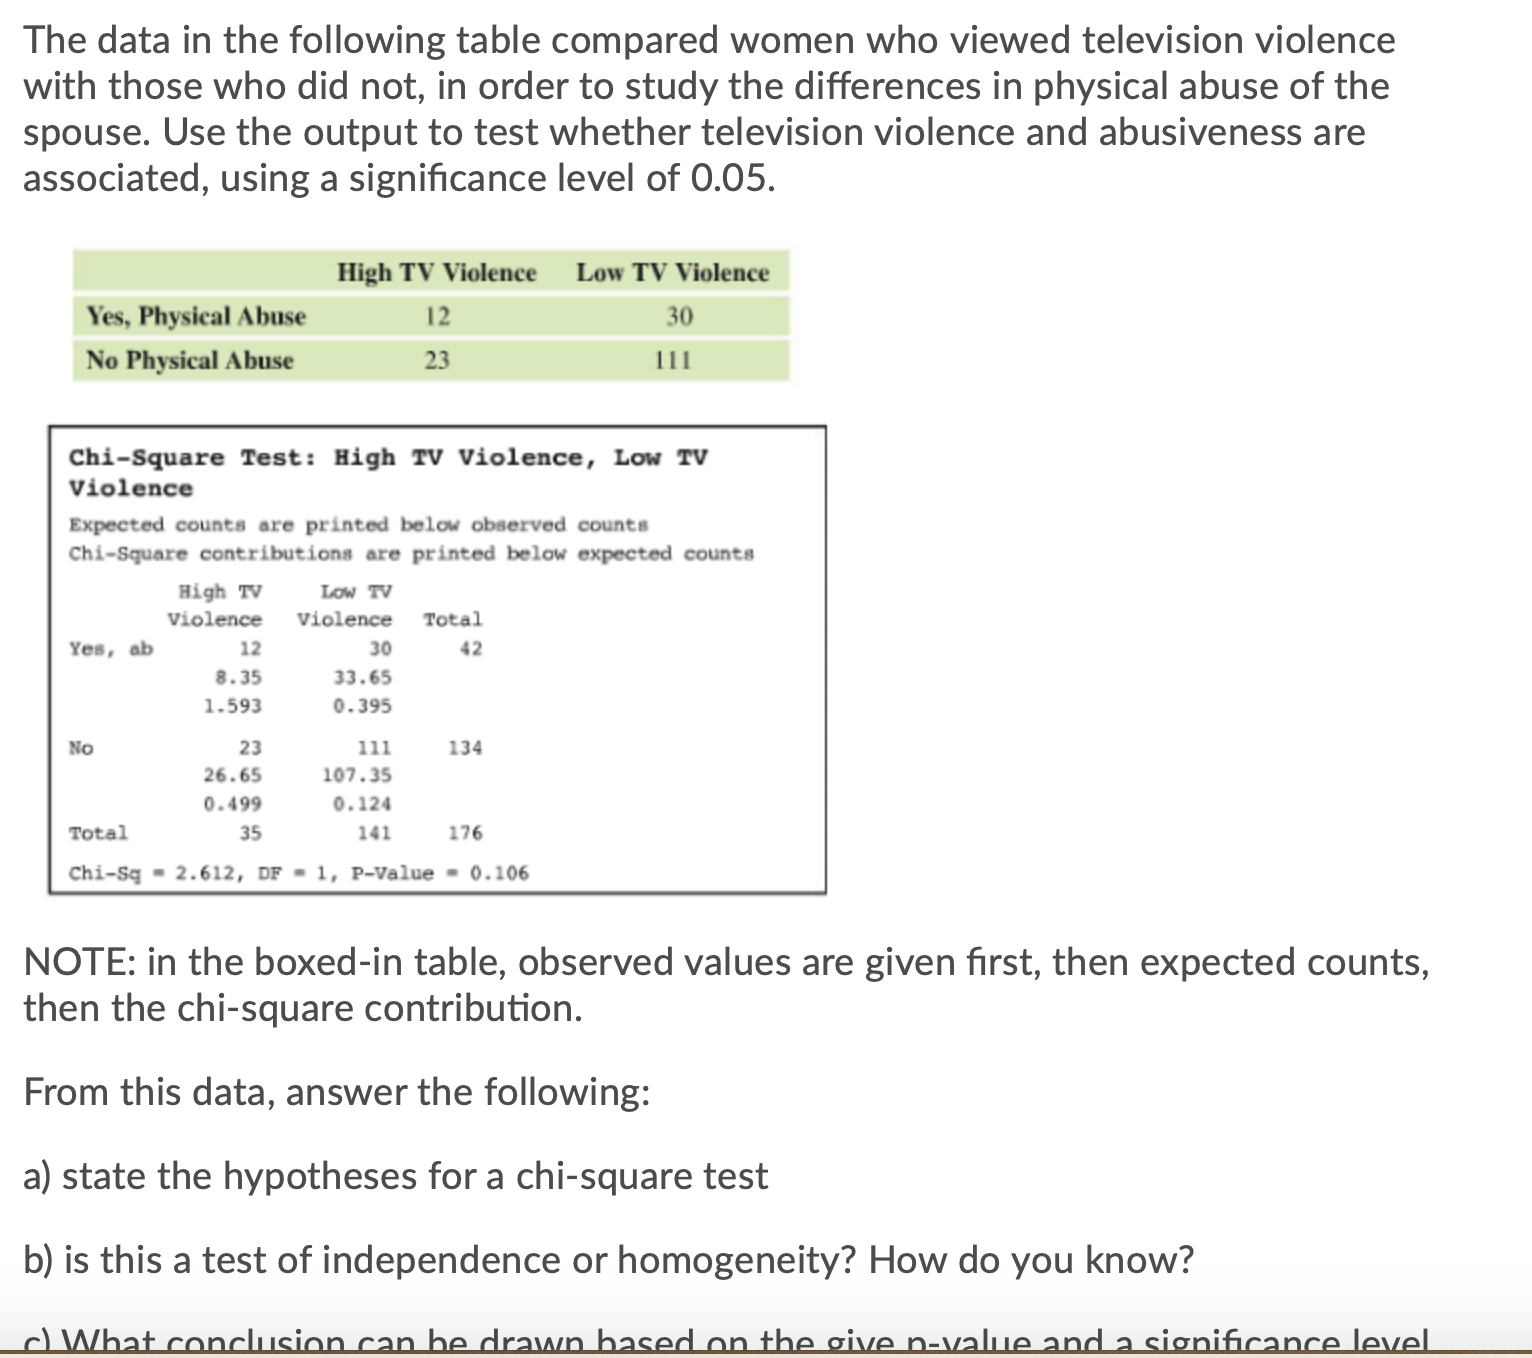
Transcribed Image Text:The data in the following table compared women who viewed television violence
with those who did not, in order to study the differences in physical abuse of the
spouse. Use the output to test whether television violence and abusiveness are
associated, using a significance level of 0.05.
High TV Violence Low TV Violence
Yes, Physical Abuse
12
30
No Physical Abuse
23
111
Chi-Square Test: High TV Violence, Low TV
Violence
Expected counts are printed below observed counts
Chi-Square contributions are printed below expected counts
High TV
Low TV
Violence violence Total
Yes, ab
12
30
42
8.35
33.65
1.593
0.395
No
23
111
134
26.65
107.35
0.499
0.124
Total
35
141
176
Chi-Sq - 2.612, DF = 1, P-Value - 0.106
NOTE: in the boxed-in table, observed values are given first, then expected counts,
then the chi-square contribution.
From this data, answer the following:
a) state the hypotheses for a chi-square test
b) is this a test of independence or homogeneity? How do you know?
a What conclusion can he drawn based on the give n-value and a significance. level.
Expert Solution
This question has been solved!
Explore an expertly crafted, step-by-step solution for a thorough understanding of key concepts.

This is a popular solution!

Trending now
This is a popular solution!

Step by step
Solved in 2 steps

Knowledge Booster


Learn more about
Need a deep-dive on the concept behind this application? Look no further. Learn more about this topic, statistics and related others by exploring similar questions and additional content below.Recommended textbooks for you
Glencoe Algebra 1, Student Edition, 9780079039897…
Algebra
ISBN:
9780079039897
Author:
Carter
Publisher:
McGraw Hill
Glencoe Algebra 1, Student Edition, 9780079039897…
Algebra
ISBN:
9780079039897
Author:
Carter
Publisher:
McGraw Hill