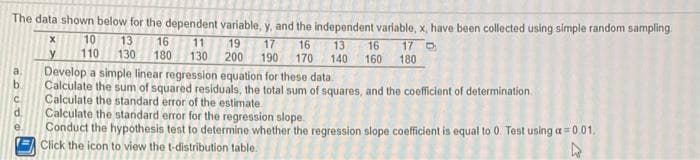
The data shown below for the dependent variable, y, and the independent variable, x, have been collected using simple random sampling 13 130 10 16 180 11 19 17 16 13 140 16 160 17 O 180 110 130 200 190 170 Develop a simple linear regression equation for these data. b. Calculate the sum of squared residuals, the total sum of squares, and the coefficient of determination. C. Calculate the standard error of the estimate


Correlation
Correlation defines a relationship between two independent variables. It tells the degree to which variables move in relation to each other. When two sets of data are related to each other, there is a correlation between them.
Linear Correlation
A correlation is used to determine the relationships between numerical and categorical variables. In other words, it is an indicator of how things are connected to one another. The correlation analysis is the study of how variables are related.
Regression Analysis
Regression analysis is a statistical method in which it estimates the relationship between a dependent variable and one or more independent variable. In simple terms dependent variable is called as outcome variable and independent variable is called as predictors. Regression analysis is one of the methods to find the trends in data. The independent variable used in Regression analysis is named Predictor variable. It offers data of an associated dependent variable regarding a particular outcome.

Step by step
Solved in 2 steps with 3 images


