The distribution of daily demand for rental trucks at a vehicle rental company is shown in the following table: Relative Frequency Demand 0.13 0.15 1 0.17 2 0.11 3 0.12 4 0.07 0.25 Trucks are rented by the day only and the company makes $16 per rented truck per day. The rental company keeps four trucks at this location. Assuming that the stocking decision is optimal, what is the implied range of excess cost per truck per day? a. O and 107.077 b. 7.52941 and 12.5714 c. 5.33333 and 7.52941 d. 12.5714 and 19.5556 e. 41.1429 and 78.1176
The distribution of daily demand for rental trucks at a vehicle rental company is shown in the following table: Relative Frequency Demand 0.13 0.15 1 0.17 2 0.11 3 0.12 4 0.07 0.25 Trucks are rented by the day only and the company makes $16 per rented truck per day. The rental company keeps four trucks at this location. Assuming that the stocking decision is optimal, what is the implied range of excess cost per truck per day? a. O and 107.077 b. 7.52941 and 12.5714 c. 5.33333 and 7.52941 d. 12.5714 and 19.5556 e. 41.1429 and 78.1176

MATLAB: An Introduction with Applications
6th Edition
ISBN:9781119256830
Author:Amos Gilat
Publisher:Amos Gilat
Chapter1: Starting With Matlab
Section: Chapter Questions
Problem 1P

Related questions
Question
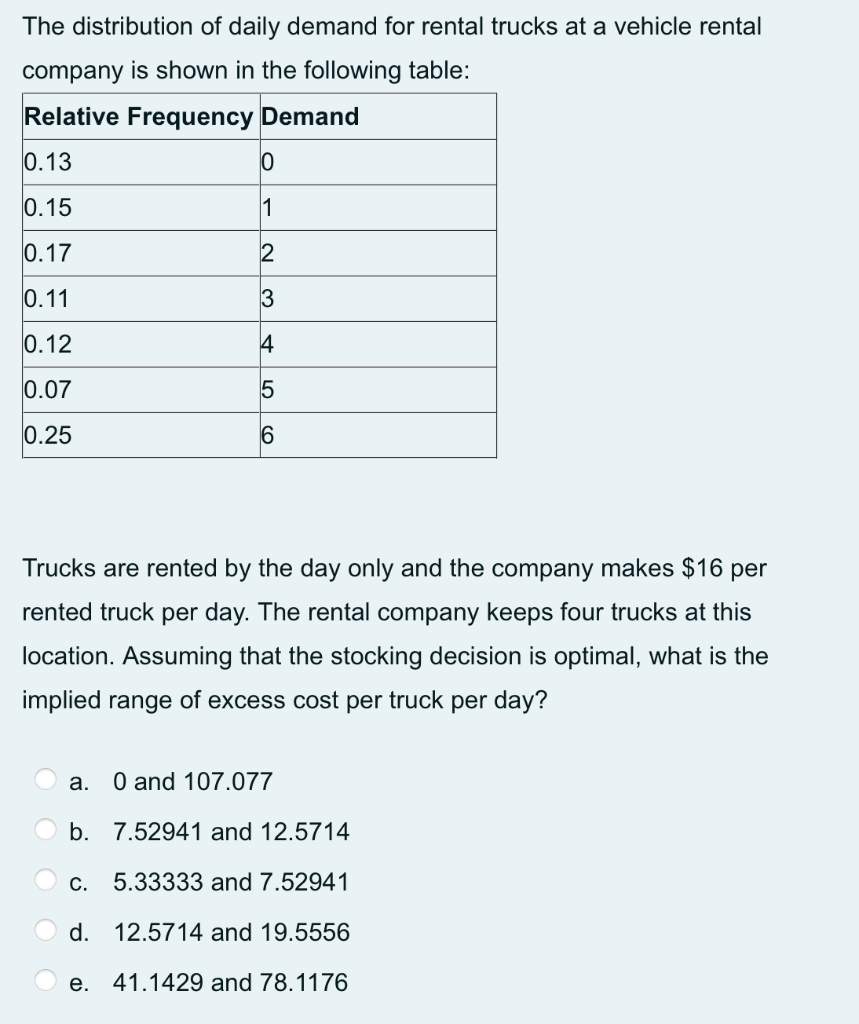
Transcribed Image Text:The distribution of daily demand for rental trucks at a vehicle rental
company is shown in the following table:
Relative Frequency Demand
0.13
0.15
1
0.17
2
0.11
3
0.12
4
0.07
0.25
Trucks are rented by the day only and the company makes $16 per
rented truck per day. The rental company keeps four trucks at this
location. Assuming that the stocking decision is optimal, what is the
implied range of excess cost per truck per day?
a. O and 107.077
b. 7.52941 and 12.5714
c. 5.33333 and 7.52941
d. 12.5714 and 19.5556
e. 41.1429 and 78.1176
Expert Solution
This question has been solved!
Explore an expertly crafted, step-by-step solution for a thorough understanding of key concepts.

Step by step
Solved in 2 steps with 2 images

Recommended textbooks for you
MATLAB: An Introduction with Applications
Statistics
ISBN:
9781119256830
Author:
Amos Gilat
Publisher:
John Wiley & Sons Inc

Probability and Statistics for Engineering and th…
Statistics
ISBN:
9781305251809
Author:
Jay L. Devore
Publisher:
Cengage Learning

Statistics for The Behavioral Sciences (MindTap C…
Statistics
ISBN:
9781305504912
Author:
Frederick J Gravetter, Larry B. Wallnau
Publisher:
Cengage Learning
MATLAB: An Introduction with Applications
Statistics
ISBN:
9781119256830
Author:
Amos Gilat
Publisher:
John Wiley & Sons Inc
Probability and Statistics for Engineering and th…
Statistics
ISBN:
9781305251809
Author:
Jay L. Devore
Publisher:
Cengage Learning
Statistics for The Behavioral Sciences (MindTap C…
Statistics
ISBN:
9781305504912
Author:
Frederick J Gravetter, Larry B. Wallnau
Publisher:
Cengage Learning

Elementary Statistics: Picturing the World (7th E…
Statistics
ISBN:
9780134683416
Author:
Ron Larson, Betsy Farber
Publisher:
PEARSON

The Basic Practice of Statistics
Statistics
ISBN:
9781319042578
Author:
David S. Moore, William I. Notz, Michael A. Fligner
Publisher:
W. H. Freeman

Introduction to the Practice of Statistics
Statistics
ISBN:
9781319013387
Author:
David S. Moore, George P. McCabe, Bruce A. Craig
Publisher:
W. H. Freeman