VIRTUAL GAMING SYSTEMS [Income Statement for the year ending December 31, 2021 Net sales 2,991,000 Cost of goods sold 1,941,000 Gross profit 1,050,000 Expenses: Operating expenses 849,000 Depreciation expense 22,500 Loss on sale of land 7,100 Interest expense 10,500 Income tax expense 39,000 Total expenses 928,100 Net income 121,900 VIRTUAL GAMING SYSTEMS Balance Sheets December 31 2021 2020 Current assets: Cash 177,000 135,000 Accounts receivable 72,000 51,000 Inventory 96,000 126,000 Prepaid rent 11,100 4,920 Long-term assets: Investment in bonds 96,000 0 Land 201,000 231,000 Equipment 261,000 201,000 Less: Accum Deprec (55,500) (33,000) Total assets 858,600 715,920 Liabilities and Stockholders' Equity Current liabilities: Accounts payable 57,000 72,000 Interest payable 4,200 2,100 Income tax payable 10,500 13,100 Long-term liabilities: Notes payable 276,000 216,000 Stockholders' equity: Common stock 291,000 291,000 Retained earnings 219,900 121,720 Total liabilities &stockholders’ equity 858,600 715,920 Question 6: Assuming that all sales were on account, calculate the following risk ratios for 2021 using the data in the tables above. (Use 365 days a year & round answers to 1 decimal place) 6a: Receivables turnover ratio 6b: Average Collection Period 6c: Inventory Turnover Ratio 6d: Average Days in Inventory: 6e: Current Ratio: 6f: Acid-test ratio: 6g: Debt to Equity Ratio:
VIRTUAL GAMING SYSTEMS [Income Statement for the year ending December 31, 2021 Net sales 2,991,000 Cost of goods sold 1,941,000 Gross profit 1,050,000 Expenses: Operating expenses 849,000 Depreciation expense 22,500 Loss on sale of land 7,100 Interest expense 10,500 Income tax expense 39,000 Total expenses 928,100 Net income 121,900 VIRTUAL GAMING SYSTEMS Balance Sheets December 31 2021 2020 Current assets: Cash 177,000 135,000 Accounts receivable 72,000 51,000 Inventory 96,000 126,000 Prepaid rent 11,100 4,920 Long-term assets: Investment in bonds 96,000 0 Land 201,000 231,000 Equipment 261,000 201,000 Less: Accum Deprec (55,500) (33,000) Total assets 858,600 715,920 Liabilities and Stockholders' Equity Current liabilities: Accounts payable 57,000 72,000 Interest payable 4,200 2,100 Income tax payable 10,500 13,100 Long-term liabilities: Notes payable 276,000 216,000 Stockholders' equity: Common stock 291,000 291,000 Retained earnings 219,900 121,720 Total liabilities &stockholders’ equity 858,600 715,920 Question 6: Assuming that all sales were on account, calculate the following risk ratios for 2021 using the data in the tables above. (Use 365 days a year & round answers to 1 decimal place) 6a: Receivables turnover ratio 6b: Average Collection Period 6c: Inventory Turnover Ratio 6d: Average Days in Inventory: 6e: Current Ratio: 6f: Acid-test ratio: 6g: Debt to Equity Ratio:

Managerial Accounting: The Cornerstone of Business Decision-Making
7th Edition
ISBN:9781337115773
Author:Maryanne M. Mowen, Don R. Hansen, Dan L. Heitger
Publisher:Maryanne M. Mowen, Don R. Hansen, Dan L. Heitger
Chapter15: Financial Statement Analysis
Section: Chapter Questions
Problem 19BEA

Related questions
Question
Question 4: [Please see attached screenshot and answer all questions]
Question 5: [Please see screenshot and answer all questions]
| VIRTUAL GAMING SYSTEMS [Income Statement for the year ending December 31, 2021 | ||
| Net sales | 2,991,000 | |
| Cost of goods sold | 1,941,000 | |
| Gross profit | 1,050,000 | |
| Expenses: | ||
| Operating expenses | 849,000 | |
| 22,500 | ||
| Loss on sale of land | 7,100 | |
| Interest expense | 10,500 | |
| Income tax expense | 39,000 | |
| Total expenses | 928,100 | |
| Net income | 121,900 |
| VIRTUAL GAMING SYSTEMS Balance Sheets December 31 |
||
| 2021 | 2020 | |
| Current assets: | ||
| Cash | 177,000 | 135,000 |
| 72,000 | 51,000 | |
| Inventory | 96,000 | 126,000 |
| Prepaid rent | 11,100 | 4,920 |
| Long-term assets: | ||
| Investment in bonds | 96,000 | 0 |
| Land | 201,000 | 231,000 |
| Equipment | 261,000 | 201,000 |
| Less: Accum Deprec | (55,500) | (33,000) |
| Total assets | 858,600 | 715,920 |
| Liabilities and |
||
| Current liabilities: | ||
| Accounts payable | 57,000 | 72,000 |
| Interest payable | 4,200 | 2,100 |
| Income tax payable | 10,500 | 13,100 |
| Long-term liabilities: | ||
| Notes payable | 276,000 | 216,000 |
| Stockholders' equity: | ||
| Common stock | 291,000 | 291,000 |
| 219,900 | 121,720 | |
| Total liabilities &stockholders’ equity | 858,600 | 715,920 |
Question 6: Assuming that all sales were on account, calculate the following risk ratios for 2021 using the data in the tables above. (Use 365 days a year & round answers to 1 decimal place)
6a: Receivables turnover ratio
6b: Average Collection Period
6c: Inventory Turnover Ratio
6d: Average Days in Inventory:
6e:
6f: Acid-test ratio:
6g: Debt to Equity Ratio:
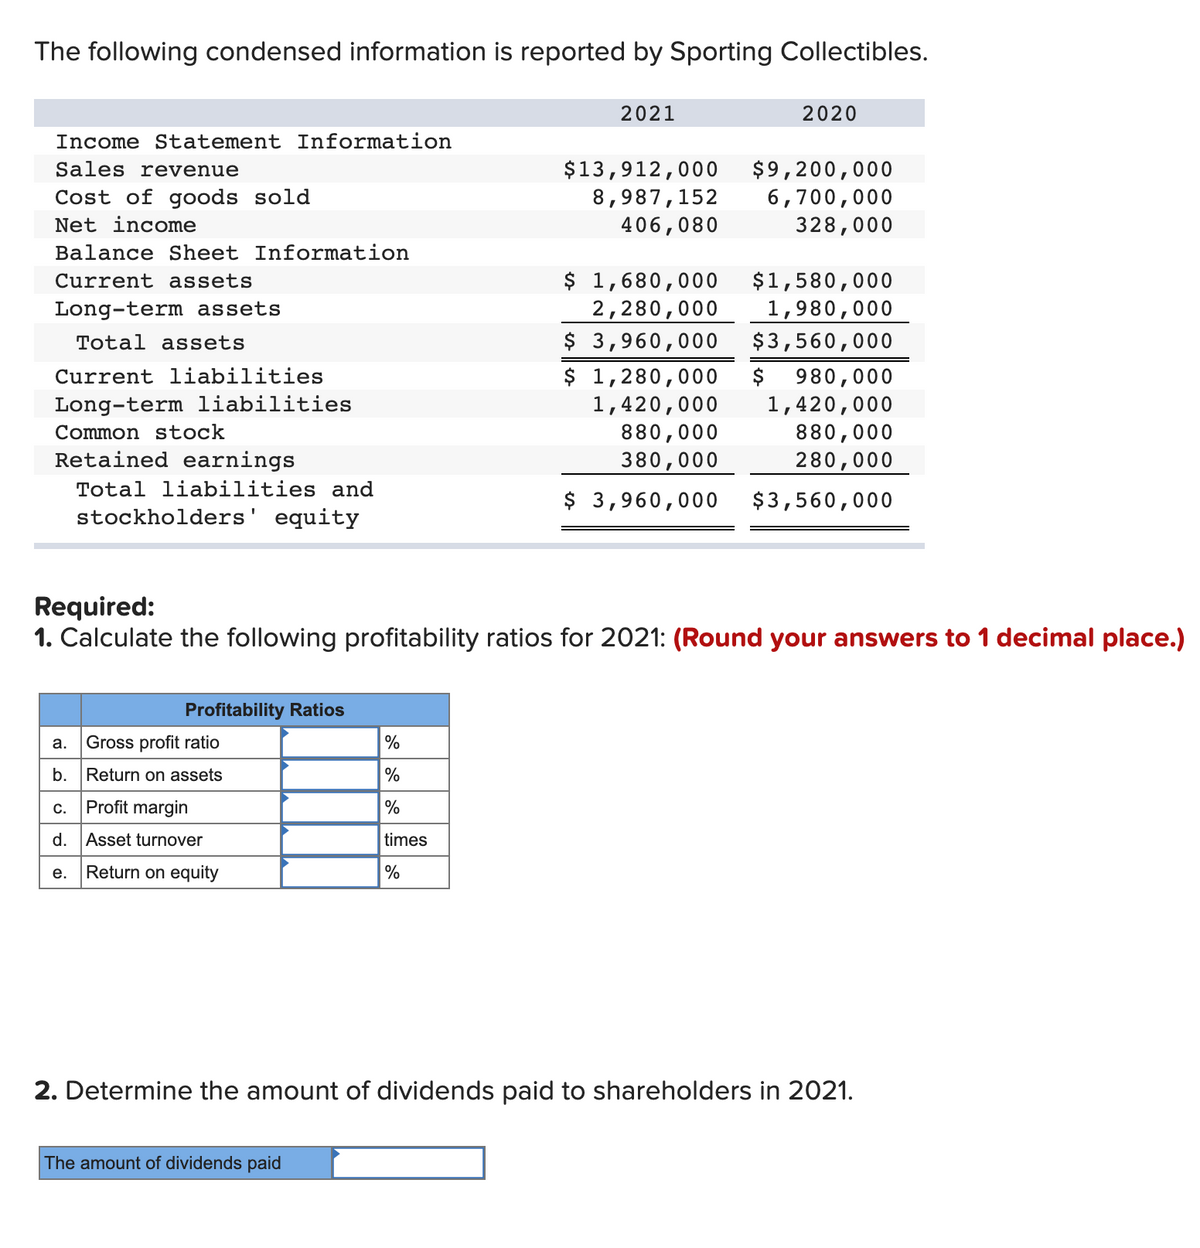
Transcribed Image Text:The following condensed information is reported by Sporting Collectibles.
2021
2020
Income Statement Information
Sales revenue
Cost of goods sold
Net income
$13,912,000
8,987,152
406,080
$9,200,000
6,700,000
328,000
Balance Sheet Information
$ 1,680,000
2,280,000
$ 3,960,000
Current assets
$1,580,000
Long-term assets
1,980,000
Total assets
$3,560,000
$ 1,280,000
1,420,000
880,000
Current liabilities
$
980,000
1,420,000
880,000
280,000
Long-term liabilities
Common stock
Retained earnings
380,000
Total liabilities and
$ 3,960,000
$3,560,000
stockholders' equity
Required:
1. Calculate the following profitability ratios for 2021: (Round your answers to 1 decimal place.)
Profitability Ratios
а.
Gross profit ratio
%
b.
Return on assets
%
Profit margin
%
C.
d. Asset turnover
times
Return on equity
%
е.
2. Determine the amount of dividends paid to shareholders in 2021.
The amount of dividends paid
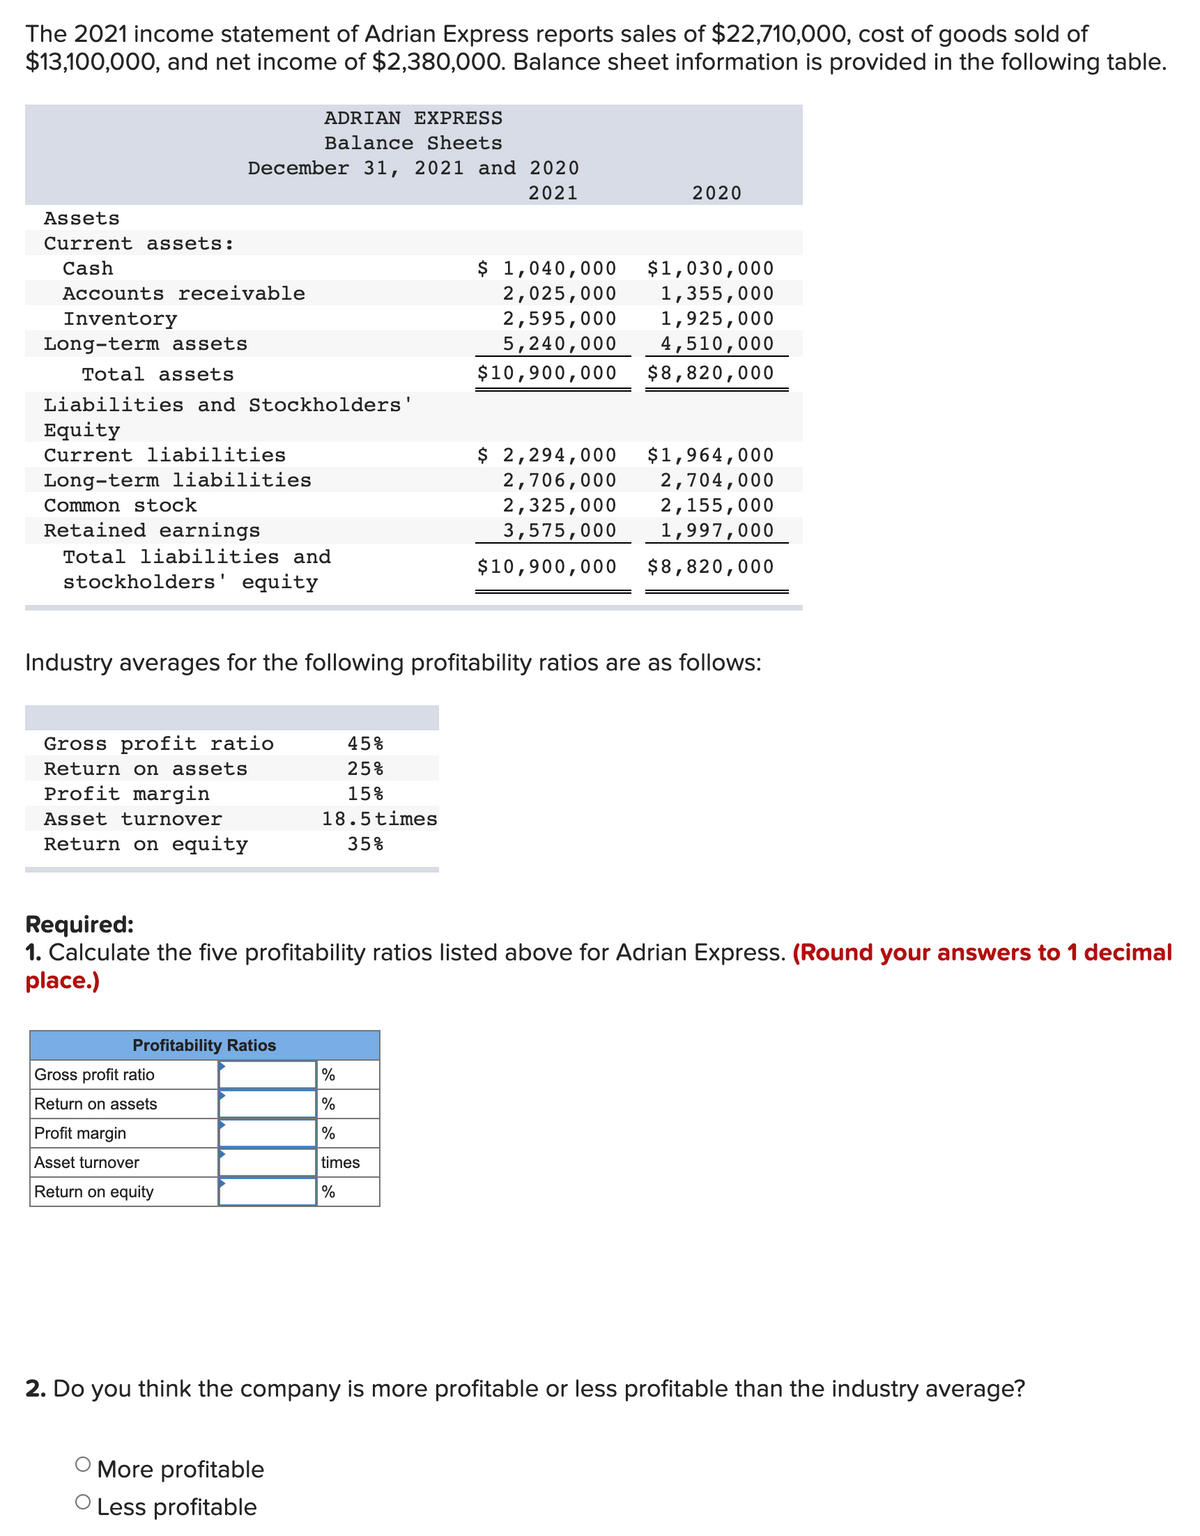
Transcribed Image Text:The 2021 income statement of Adrian Express reports sales of $22,710,000, cost of goods sold of
$13,100,000, and net income of $2,380,00O. Balance sheet information is provided in the following table.
ADRIAΝ ΕXPRES S
Balance Sheets
December 31, 2021 and 2020
2021
2020
Assets
Current assets:
$ 1,040,000
2,025,000
2,595,000
$1,030,000
1,355,000
1,925,000
Cash
Accounts receivable
Inventory
5,240,000
$10,900,000
4,510,000
$8,820,000
Long-term assets
Total assets
Liabilities and Stockholders'
Equity
$ 2,294,000
2,706,000
2,325,000
$1,964,000
2,704,000
2,155,000
1,997,000
Current liabilities
Long-term liabilities
Common stock
Retained earnings
3,575,000
Total liabilities and
$10,900,000
$8,820,000
stockholders' equity
Industry averages for the following profitability ratios are as follows:
Gross profit ratio
45%
Return on assets
25%
Profit margin
15%
Asset turnover
18.5times
Return on equity
35%
Required:
1. Calculate the five profitability ratios listed above for Adrian Express. (Round your answers to 1 decimal
place.)
Profitability Ratios
Gross profit ratio
%
Return on assets
%
Profit margin
%
Asset turnover
times
Return on equity
%
2. Do you think the company is more profitable or less profitable than the industry average?
More profitable
O Less profitable
Expert Solution
This question has been solved!
Explore an expertly crafted, step-by-step solution for a thorough understanding of key concepts.

This is a popular solution!

Trending now
This is a popular solution!

Step by step
Solved in 3 steps

Knowledge Booster


Learn more about
Need a deep-dive on the concept behind this application? Look no further. Learn more about this topic, accounting and related others by exploring similar questions and additional content below.Recommended textbooks for you
Managerial Accounting: The Cornerstone of Busines…
Accounting
ISBN:
9781337115773
Author:
Maryanne M. Mowen, Don R. Hansen, Dan L. Heitger
Publisher:
Cengage Learning

Intermediate Accounting: Reporting And Analysis
Accounting
ISBN:
9781337788281
Author:
James M. Wahlen, Jefferson P. Jones, Donald Pagach
Publisher:
Cengage Learning

Cornerstones of Financial Accounting
Accounting
ISBN:
9781337690881
Author:
Jay Rich, Jeff Jones
Publisher:
Cengage Learning
Managerial Accounting: The Cornerstone of Busines…
Accounting
ISBN:
9781337115773
Author:
Maryanne M. Mowen, Don R. Hansen, Dan L. Heitger
Publisher:
Cengage Learning
Intermediate Accounting: Reporting And Analysis
Accounting
ISBN:
9781337788281
Author:
James M. Wahlen, Jefferson P. Jones, Donald Pagach
Publisher:
Cengage Learning
Cornerstones of Financial Accounting
Accounting
ISBN:
9781337690881
Author:
Jay Rich, Jeff Jones
Publisher:
Cengage Learning

Fundamentals Of Financial Management, Concise Edi…
Finance
ISBN:
9781337902571
Author:
Eugene F. Brigham, Joel F. Houston
Publisher:
Cengage Learning

Survey of Accounting (Accounting I)
Accounting
ISBN:
9781305961883
Author:
Carl Warren
Publisher:
Cengage Learning
