Introduction to the Practice of Statistics: w/CrunchIt/EESEE Access Card
8th Edition
ISBN: 9781464158933
Author: David S. Moore, George P. McCabe, Bruce A. Craig
Publisher: W. H. Freeman
bartleby

Concept explainers

bartleby

Videos

Question
Book Icon
Chapter 1, Problem 156E
To determine

To find: The numerical and graphical summary for the provided data of two types of vehicles and a short summary of the major features of this distribution.

Expert Solution & Answer
Check Mark

Answer to Problem 156E

Solution: The five-number summary for the provided data is shown below:

Car Minimum First Quartile Median Third Quartile Maximum
Small Cars 33.00 33.75 34.00 37.00 50.00
Sporty Cars 29.00 29.00 30.00 31.00 33.00

From the boxplot, it can be said that the distribution of the small cars and sporty cars are right skewed with two outliers and symmetric respectively.

Explanation of Solution

Calculation: The numerical summary of the two types of vehicles are provided through the five-number summary. To obtain the five-number summary, follow the below mentioned steps in Minitab software.

Step 1: Enter the observations in the Minitab worksheet.

Step 2: Go to Stat Basic Statistics Display Descriptive Statistics.

Step 3: Select “MPG” in the variable option. And select “Car_Class” under “By variable” option.

Step 4: Click on the Statistics button.

Step 5: Select minimum, maximum, first quartile, third quartile and median.

Step 6: Click OK.

The below table shows the five number summary of the two types of cars.

Car Minimum First Quartile Median Third Quartile Maximum
Small Cars 33.00 33.75 34.00 37.00 50.00
Sporty Cars 29.00 29.00 30.00 31.00 33.00

Graph: To draw the side-by-side boxplots, the below steps are followed in Minitab software.

Step 1: Enter the data in Minitab.

Step 2: Go to “Graph” and select “Boxplot”.

Step 3: Select “With Groups” under “One Y”. Then click on OK.

Step 4: Select the variables “MPG” and “Car_Class” in the “Graph variables” and “Categorical variables for grouping” respectively.

Step 5: Click OK.

The obtained boxplot is shown below.

Introduction to the Practice of Statistics: w/CrunchIt/EESEE Access Card, Chapter 1, Problem 156E

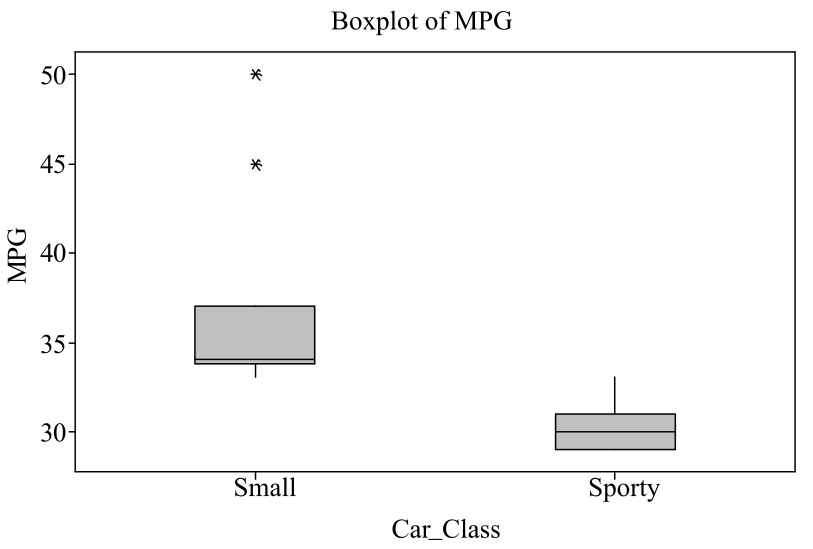
From the obtained boxplot, it can be said that the data of small cars has two outliers and the distribution is right skewed. But the data on the fuel efficiency of the sporty cars is more or less symmetric according to the boxplot and the data does not have any outliers.

Interpretation: The distribution of fuel efficiency of small cars and sporty cars are right skewed and symmetric respectively.

Want to see more full solutions like this?

Subscribe now to access step-by-step solutions to millions of textbook problems written by subject matter experts!

Chapter 1 Solutions

Introduction to the Practice of Statistics: w/CrunchIt/EESEE Access Card

Ch. 1.1 - Prob. 11ECh. 1.1 - Prob. 12ECh. 1.1 - Prob. 13ECh. 1.1 - Prob. 14ECh. 1.1 - Prob. 15ECh. 1.2 - Prob. 16UYKCh. 1.2 - Prob. 17UYKCh. 1.2 - Prob. 18UYKCh. 1.2 - Prob. 19UYKCh. 1.2 - Prob. 20UYKCh. 1.2 - Prob. 21UYKCh. 1.2 - Prob. 22UYKCh. 1.2 - Prob. 23UYKCh. 1.2 - Prob. 24UYKCh. 1.2 - Prob. 25ECh. 1.2 - Prob. 26ECh. 1.2 - Prob. 27ECh. 1.2 - Prob. 28ECh. 1.2 - Prob. 29ECh. 1.2 - Prob. 30ECh. 1.2 - Prob. 31ECh. 1.2 - Prob. 32ECh. 1.2 - Prob. 33ECh. 1.2 - Prob. 34ECh. 1.2 - Prob. 35ECh. 1.2 - Prob. 42ECh. 1.2 - Prob. 36ECh. 1.2 - Prob. 43ECh. 1.2 - Prob. 37ECh. 1.2 - Prob. 44ECh. 1.2 - Prob. 38ECh. 1.2 - Prob. 45ECh. 1.2 - Prob. 46ECh. 1.2 - Prob. 39ECh. 1.2 - Prob. 40ECh. 1.2 - Prob. 41ECh. 1.3 - Prob. 47UYKCh. 1.3 - Prob. 48UYKCh. 1.3 - Prob. 49UYKCh. 1.3 - Prob. 50UYKCh. 1.3 - Prob. 51UYKCh. 1.3 - Prob. 52UYKCh. 1.3 - Prob. 53UYKCh. 1.3 - Prob. 54UYKCh. 1.3 - Prob. 55UYKCh. 1.3 - Prob. 56UYKCh. 1.3 - Prob. 57UYKCh. 1.3 - Prob. 58UYKCh. 1.3 - Prob. 59UYKCh. 1.3 - Prob. 60UYKCh. 1.3 - Prob. 67ECh. 1.3 - Prob. 69ECh. 1.3 - Prob. 61ECh. 1.3 - Prob. 62ECh. 1.3 - Prob. 63ECh. 1.3 - Prob. 64ECh. 1.3 - Prob. 65ECh. 1.3 - Prob. 66ECh. 1.3 - Prob. 74ECh. 1.3 - Prob. 75ECh. 1.3 - Prob. 76ECh. 1.3 - Prob. 71ECh. 1.3 - Prob. 68ECh. 1.3 - Prob. 70ECh. 1.3 - Prob. 77ECh. 1.3 - Prob. 78ECh. 1.3 - Prob. 79ECh. 1.3 - Prob. 80ECh. 1.3 - Prob. 81ECh. 1.3 - Prob. 82ECh. 1.3 - Prob. 83ECh. 1.3 - Prob. 84ECh. 1.3 - Prob. 85ECh. 1.3 - Prob. 86ECh. 1.3 - Prob. 87ECh. 1.3 - Prob. 88ECh. 1.3 - Prob. 89ECh. 1.3 - Prob. 90ECh. 1.3 - Prob. 91ECh. 1.3 - Prob. 92ECh. 1.3 - Prob. 93ECh. 1.3 - Prob. 94ECh. 1.3 - Prob. 95ECh. 1.3 - Prob. 96ECh. 1.3 - Prob. 72ECh. 1.3 - Prob. 97ECh. 1.3 - Prob. 98ECh. 1.3 - Prob. 99ECh. 1.3 - Prob. 100ECh. 1.3 - Prob. 73ECh. 1.4 - Prob. 101UYKCh. 1.4 - Prob. 102UYKCh. 1.4 - Prob. 103UYKCh. 1.4 - Prob. 104UYKCh. 1.4 - Prob. 105UYKCh. 1.4 - Prob. 106UYKCh. 1.4 - Prob. 107UYKCh. 1.4 - Prob. 108UYKCh. 1.4 - Prob. 109ECh. 1.4 - Prob. 110ECh. 1.4 - Prob. 111ECh. 1.4 - Prob. 112ECh. 1.4 - Prob. 113ECh. 1.4 - Prob. 114ECh. 1.4 - Prob. 115ECh. 1.4 - Prob. 116ECh. 1.4 - Prob. 117ECh. 1.4 - Prob. 118ECh. 1.4 - Prob. 119ECh. 1.4 - Prob. 120ECh. 1.4 - Prob. 121ECh. 1.4 - Prob. 122ECh. 1.4 - Prob. 123ECh. 1.4 - Prob. 124ECh. 1.4 - Prob. 125ECh. 1.4 - Prob. 126ECh. 1.4 - Prob. 127ECh. 1.4 - Prob. 128ECh. 1.4 - Prob. 129ECh. 1.4 - Prob. 130ECh. 1.4 - Prob. 131ECh. 1.4 - Prob. 132ECh. 1.4 - Prob. 133ECh. 1.4 - Prob. 134ECh. 1.4 - Prob. 135ECh. 1.4 - Prob. 136ECh. 1.4 - Prob. 137ECh. 1.4 - Prob. 138ECh. 1.4 - Prob. 139ECh. 1.4 - Prob. 140ECh. 1.4 - Prob. 141ECh. 1.4 - Prob. 142ECh. 1.4 - Prob. 143ECh. 1.4 - Prob. 144ECh. 1.4 - Prob. 145ECh. 1.4 - Prob. 146ECh. 1.4 - Prob. 147ECh. 1.4 - Prob. 148ECh. 1.4 - Prob. 149ECh. 1.4 - Prob. 150ECh. 1.4 - Prob. 151ECh. 1.4 - Prob. 152ECh. 1.4 - Prob. 153ECh. 1.4 - Prob. 154ECh. 1.4 - Prob. 155ECh. 1 - Prob. 156ECh. 1 - Prob. 157ECh. 1 - Prob. 158ECh. 1 - Prob. 159ECh. 1 - Prob. 160ECh. 1 - Prob. 161ECh. 1 - Prob. 162ECh. 1 - Prob. 163ECh. 1 - Prob. 164ECh. 1 - Prob. 165ECh. 1 - Prob. 166ECh. 1 - Prob. 167ECh. 1 - Prob. 168ECh. 1 - Prob. 169ECh. 1 - Prob. 170ECh. 1 - Prob. 171ECh. 1 - Prob. 172ECh. 1 - Prob. 173ECh. 1 - Prob. 174ECh. 1 - Prob. 175ECh. 1 - Prob. 176ECh. 1 - Prob. 177E
Knowledge Booster
Background pattern image
Statistics
Learn more about
Need a deep-dive on the concept behind this application? Look no further. Learn more about this topic, statistics and related others by exploring similar questions and additional content below.
Recommended textbooks for you
Text book image
Glencoe Algebra 1, Student Edition, 9780079039897...
Algebra
ISBN:9780079039897
Author:Carter
Publisher:McGraw Hill
Text book image
Big Ideas Math A Bridge To Success Algebra 1: Stu...
Algebra
ISBN:9781680331141
Author:HOUGHTON MIFFLIN HARCOURT
Publisher:Houghton Mifflin Harcourt
Text book image
Functions and Change: A Modeling Approach to Coll...
Algebra
ISBN:9781337111348
Author:Bruce Crauder, Benny Evans, Alan Noell
Publisher:Cengage Learning
Text book image
Linear Algebra: A Modern Introduction
Algebra
ISBN:9781285463247
Author:David Poole
Publisher:Cengage Learning
Correlation Vs Regression: Difference Between them with definition & Comparison Chart; Author: Key Differences;https://www.youtube.com/watch?v=Ou2QGSJVd0U;License: Standard YouTube License, CC-BY
Correlation and Regression: Concepts with Illustrative examples; Author: LEARN & APPLY : Lean and Six Sigma;https://www.youtube.com/watch?v=xTpHD5WLuoA;License: Standard YouTube License, CC-BY