
Concept explainers
Videos
(a)
To find: The graphical and numerical summary of the provided data of number of users of internet per 100 people in the year 2010 (Users2010) and to find the numerical summaries of the provided data.
Solution: The obtained histogram indicates that distribution of the data is right skewed. According to the numerical summary, mean of the data is 35.64, minimum value of the data is 0.21, first
(a)
Explanation of Solution
Given: The data of number of users of internet per 100 people (Users2010) is provided in the question.
| Country Name | Users2010 | Users2011 |
| Afghanistan | 3.65 | 4.58 |
| Albania | 45.00 | 49.00 |
| Algeria | 12.50 | 14.00 |
| Andorra | 81.00 | 81.00 |
| Angola | 10.00 | 14.78 |
| Antigua and Barbuda | 80.00 | 82.00 |
| Argentina | 40.00 | 47.70 |
| Aruba | 42.00 | 57.07 |
| Australia | 75.89 | 78.95 |
| Austria | 75.20 | 79.75 |
| Azerbaijan | 46.68 | 50.75 |
| Bahamas, The | 43.00 | 65.00 |
| Bahrain | 55.00 | 77.00 |
| Bangladesh | 3.70 | 5.00 |
| Barbados | 70.20 | 71.77 |
| Belarus | 32.15 | 39.96 |
| Belgium | 73.74 | 76.20 |
| Benin | 3.13 | 3.50 |
| Bermuda | 85.13 | 88.85 |
| Bhutan | 13.60 | 21.00 |
| Bolivia | 22.40 | 30.00 |
| Bosnia and Herzegovina | 52.00 | 60.00 |
| Botswana | 6.00 | 7.00 |
| Brazil | 40.65 | 45.00 |
| Brunei Darussalam | 53.00 | 56.00 |
| Bulgaria | 45.98 | 50.80 |
| Burkina Faso | 2.40 | 3.00 |
| Burundi | 1.00 | 1.11 |
| Cambodia | 1.26 | 3.10 |
| Cameroon | 4.30 | 5.00 |
| Canada | 80.04 | 82.68 |
| Cape Verde | 30.00 | 32.00 |
| Cayman Islands | 66.00 | 69.47 |
| Central African Republic | 2.00 | 2.20 |
| Chad | 1.70 | 1.90 |
| Chile | 45.00 | 53.89 |
| China | 34.39 | 38.40 |
| Colombia | 36.50 | 40.40 |
| Comoros | 5.10 | 5.50 |
| Congo, Dem. Rep. | 0.72 | 1.20 |
| Congo, Rep. | 5.00 | 5.60 |
| Costa Rica | 36.50 | 42.12 |
| Cote d'Ivoire | 2.10 | 2.20 |
| Croatia | 60.12 | 70.53 |
| Cuba | 15.90 | 23.23 |
| Cyprus | 52.99 | 57.68 |
| Czech Republic | 68.64 | 72.89 |
| Denmark | 88.76 | 89.98 |
| Djibouti | 6.50 | 7.00 |
| Dominica | 47.45 | 51.31 |
| Dominican Republic | 31.40 | 35.50 |
| Ecuador | 29.03 | 31.40 |
| Egypt, Arab Rep. | 30.20 | 35.62 |
| El Salvador | 15.90 | 17.69 |
| Eritrea | 5.40 | 6.20 |
| Estonia | 74.15 | 76.53 |
| Ethiopia | 0.75 | 1.10 |
| Faeroe Islands | 75.20 | 80.73 |
| Fiji | 20.00 | 28.00 |
| Finland | 86.91 | 89.33 |
| France | 77.28 | 76.77 |
| French Polynesia | 49.00 | 49.00 |
| Gabon | 7.23 | 8.00 |
| Gambia, The | 9.20 | 10.87 |
| Georgia | 26.29 | 35.28 |
| Germany | 82.53 | 83.44 |
| Ghana | 9.55 | 14.11 |
| Greece | 44.57 | 53.40 |
| Greenland | 63.85 | 64.62 |
| Guatemala | 10.50 | 11.73 |
| Guinea | 1.00 | 1.30 |
| Guinea-Bissau | 2.45 | 2.67 |
| Guyana | 29.90 | 32.00 |
| Honduras | 11.09 | 15.90 |
| Hong Kong SAR, China | 71.85 | 75.03 |
| Hungary | 52.91 | 58.97 |
| Iceland | 95.63 | 96.62 |
| India | 7.50 | 10.07 |
| Indonesia | 10.92 | 18.00 |
| Iran, Islamic Rep. | 16.00 | 21.00 |
| Iraq | 2.47 | 4.95 |
| Ireland | 69.78 | 77.48 |
| Israel | 65.68 | 68.17 |
| Italy | 53.74 | 56.82 |
| Jamaica | 28.07 | 31.99 |
| Japan | 77.65 | 78.71 |
| Jordan | 27.83 | 35.74 |
| Kazakhstan | 31.03 | 44.04 |
| Kenya | 14.00 | 28.00 |
| Kiribati | 9.07 | 10.00 |
| Korea, Rep. | 81.62 | 81.46 |
| Kuwait | 61.40 | 74.20 |
| Kyrgyz Republic | 18.02 | 19.58 |
| Lao PDR | 7.00 | 9.00 |
| Latvia | 68.82 | 72.43 |
| Lebanon | 43.68 | 52.00 |
| Lesotho | 3.86 | 4.22 |
| Liberia | 2.30 | 3.00 |
| Libya | 14.00 | 17.00 |
| Liechtenstein | 80.00 | 85.00 |
| Lithuania | 62.82 | 67.17 |
| Luxembourg | 90.71 | 90.70 |
| Macao SAR, China | 53.80 | 58.00 |
| Macedonia, FYR | 51.90 | 56.70 |
| Madagascar | 1.70 | 1.90 |
| Malawi | 2.26 | 3.33 |
| Malaysia | 56.30 | 61.00 |
| Maldives | 28.30 | 34.00 |
| Mali | 1.90 | 2.00 |
| Malta | 63.08 | 69.03 |
| Mauritania | 4.00 | 4.50 |
| Mauritius | 28.73 | 35.51 |
| Mexico | 31.05 | 36.15 |
| Moldova | 32.40 | 37.85 |
| Mongolia | 12.90 | 20.00 |
| Montenegro | 37.50 | 40.00 |
| Morocco | 49.00 | 51.00 |
| Mozambique | 4.17 | 4.30 |
| Myanmar | 0.25 | 0.98 |
| Namibia | 11.60 | 12.00 |
| Nepal | 7.93 | 9.00 |
| Netherlands | 90.71 | 92.13 |
| New Caledonia | 42.66 | 51.17 |
| New Zealand | 83.01 | 86.18 |
| Nicaragua | 10.00 | 10.60 |
| Niger | 0.83 | 1.30 |
| Nigeria | 24.00 | 28.43 |
| Norway | 93.27 | 93.45 |
| Oman | 62.00 | 68.00 |
| Pakistan | 8.00 | 9.00 |
| Panama | 40.10 | 42.70 |
| Papua New Guinea | 1.28 | 2.00 |
| Paraguay | 19.80 | 23.90 |
| Peru | 34.77 | 36.50 |
| Philippines | 25.00 | 29.00 |
| Poland | 62.47 | 65.02 |
| Portugal | 51.28 | 55.57 |
| Puerto Rico | 45.63 | 48.50 |
| Qatar | 81.60 | 86.20 |
| Romania | 40.02 | 44.12 |
| Russian Federation | 43.31 | 49.31 |
| Rwanda | 8.00 | 7.00 |
| Sao Tome and Principe | 18.75 | 20.16 |
| Saudi Arabia | 41.00 | 47.50 |
| Senegal | 16.00 | 17.50 |
| Serbia | 45.56 | 47.19 |
| Seychelles | 41.00 | 43.61 |
| Singapore | 71.14 | 75.06 |
| Slovak Republic | 76.16 | 74.87 |
| Slovenia | 69.35 | 71.40 |
| Solomon Islands | 5.00 | 6.00 |
| South Africa | 18.05 | 20.95 |
| Spain | 65.81 | 67.92 |
| Sri Lanka | 12.12 | 15.13 |
| St. Lucia | 40.06 | 42.01 |
| St. Vincent and the Grenadines | 38.50 | 43.01 |
| Suriname | 31.59 | 32.00 |
| Swaziland | 12.41 | 20.43 |
| Sweden | 90.01 | 90.88 |
| Switzerland | 82.17 | 82.99 |
| Syrian Arab Republic | 20.66 | 22.44 |
| Tajikistan | 11.55 | 13.03 |
| Tanzania | 11.00 | 12.00 |
| Thailand | 22.40 | 23.70 |
| Timor-Leste | 0.21 | 0.88 |
| Togo | 3.00 | 3.50 |
| Tonga | 16.00 | 25.00 |
| Trinidad and Tobago | 48.50 | 55.20 |
| Tunisia | 36.56 | 38.81 |
| Turkey | 39.82 | 42.10 |
| Turkmenistan | 3.00 | 5.00 |
| Tuvalu | 25.00 | 30.00 |
| Uganda | 12.50 | 13.01 |
| Ukraine | 23.09 | 30.25 |
| United Arab Emirates | 68.00 | 70.00 |
| United Kingdom | 77.75 | 81.71 |
| United States | 74.25 | 78.24 |
| Uruguay | 46.57 | 51.57 |
| Uzbekistan | 19.22 | 28.57 |
| Venezuela, RB | 37.56 | 40.44 |
| Vietnam | 30.97 | 35.45 |
| West Bank and Gaza | 43.44 | 56.82 |
| Yemen, Rep. | 12.35 | 14.91 |
| Zambia | 10.13 | 11.50 |
| Zimbabwe | 11.50 | 15.70 |
Graph: To draw the histogram of the provided data, below mentioned steps are followed in Minitab.
Step 1: Enter the data into Minitab worksheet.
Step 2: Go to Graph, select Histogram and select simple and click OK.
Step 3: Select the data variable column of “Users2010” and click on Scale.
Step 4: Check minor ticks under Y Scale Low and X Scale Low and then click OK.
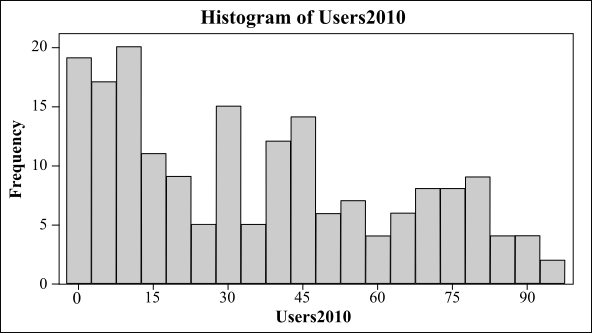
The obtained histogram is as follows:
Calculation: Use the following steps in Minitab to find the numerical summary for percent users of internet per 100 people.
Step 1. Go to stat option then click on Basis statistics and then choose Display
Step 2. Click on statistics and check minor ticks under Mean, First quartile, Median, Third quartile, Minimum and Maximum.
The numerical summary for percent of users of internet per 100 people in the year 2010 is as follows:
Interpretation: The obtained histogram of the data is plotted and it shows that the data is normal and is right skewed. The mean of the data is 35.64, minimum value of the data is 0.21, first quartile is 10.31, the median is 31.40, third quartile is 55.65 and the maximum value is 95.63.
(b)
To find: The change in number of users per 100 people from 2010 to 2011 and to analyze the changes.
(b)
Answer to Problem 163E
Solution: The minimum value of the data is
Explanation of Solution
Calculation:
Use the following steps in Minitab to find the change in number of users per 100 people from 2010 to 2011.
Step 1. Go to Calc then click on Calculator and enter change in Store result option and enter the formula ‘User2011’-‘User2010’ in the expression option and then click OK.
Step 2. Go to Stat option then click on Basis Statistics and then choose Display Descriptive Statistics.
Step 3. Click on Statistics and check minor ticks under First quartile, Median, Third quartile, Minimum and Maximum.
The numerical summary for change in number of users per 100 people from 2010 to 2011 is as follows:
To draw the histogram of the provided data, below mentioned steps are followed in Minitab.
Step 1: Enter the data into Minitab worksheet.
Step 2: Go to Graph, select Histogram and select simple and click OK.
Step 3: Select the data variable column of “change” and click on Scale.
Step 4: Check minor ticks under Y Scale Low and X Scale Low and then click OK.
The obtained histogram is as follows:
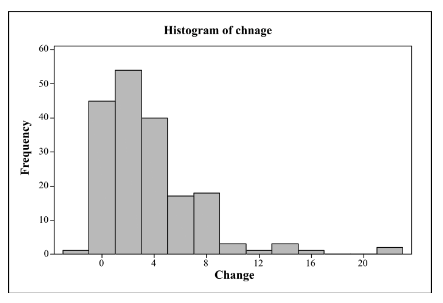
Interpretation: The obtained histogram of the data is plotted and it shows that the data is normal and is left skewed. The minimum value of the data is
(c)
To find: The percent change in number of users per 100 people from 2010 to 2011 and to analyze the changes.
(c)
Answer to Problem 163E
Solution: The minimum value of the data is
Explanation of Solution
Calculation: Use the following steps in Minitab to find the percent change in number of users per 100 people from 2010 to 2011.
Step 1. Go to Calc then click on Calculator and enter % change in Store result option and enter the formula
Step 2. Go to stat option then click on Basis statistics and then choose Display Descriptive Statistics.
Step 3. Click on statistics and check minor ticks under First quartile, Median, Third quartile, Minimum and Maximum.
The numerical summary for change in number of users per 100 people from 2010 to 2011 is as follows:
To draw the histogram of the provided data, below mentioned steps are followed in Minitab.
Step 1: Enter the data into Minitab worksheet.
Step 2: Go to Graph, select Histogram and select simple and click OK.
Step 3: Select the data variable column of “%change” and click on Scale.
Step 4: Check minor ticks under Y Scale Low and X Scale Low and then click OK.
The obtained histogram is as follows:
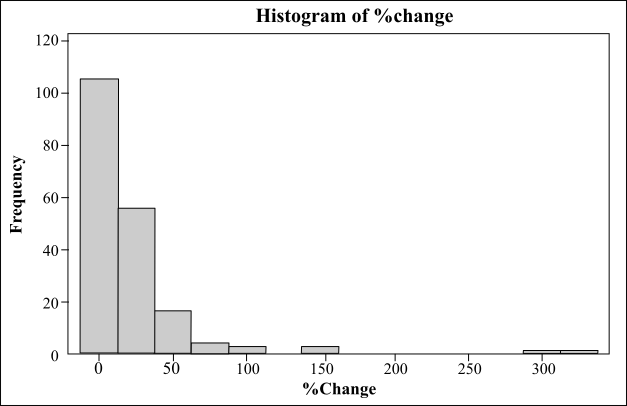
Interpretation: The obtained histogram of the data is plotted and it shows that the data is right skewed. The minimum value of the data is
(d)
The summary to the analysis from part (a) to (c) and to compare between the change and percent change in number of users per 100 people from 2010 to 2011
(d)
Answer to Problem 163E
Solution: Internet utilization has considerably expanded from 2010 to 2011 and the data for internet use in the year 2010 is right skewed.
Explanation of Solution
The data for internet use in the year 2010 is right skewed. The change in internet use from 2010 to 2011 and the percent change are also right skewed. Moreover, there is a gap between the percentage change and it is obtained from the histogram. For every one of the data, numerical summary appears the most ideal approach to depict the distribution. Internet utilization has considerably expanded from 2010 to 2011.
Want to see more full solutions like this?
Chapter 1 Solutions
Introduction to the Practice of Statistics: w/CrunchIt/EESEE Access Card


 College AlgebraAlgebraISBN:9781305115545Author:James Stewart, Lothar Redlin, Saleem WatsonPublisher:Cengage Learning
 Glencoe Algebra 1, Student Edition, 9780079039897...AlgebraISBN:9780079039897Author:CarterPublisher:McGraw Hill
 Mathematics For Machine TechnologyAdvanced MathISBN:9781337798310Author:Peterson, John.Publisher:Cengage Learning,
 Holt Mcdougal Larson Pre-algebra: Student Edition...AlgebraISBN:9780547587776Author:HOLT MCDOUGALPublisher:HOLT MCDOUGAL
 Big Ideas Math A Bridge To Success Algebra 1: Stu...AlgebraISBN:9781680331141Author:HOUGHTON MIFFLIN HARCOURTPublisher:Houghton Mifflin Harcourt
 Linear Algebra: A Modern IntroductionAlgebraISBN:9781285463247Author:David PoolePublisher:Cengage Learning