
Videos
Comparison of Performance Using Return on Investment
Comparative data on three companies in the same service industry are given below: 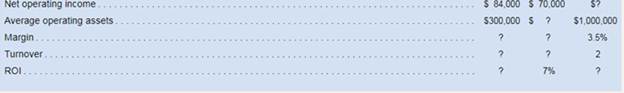
Required:
1. What advantages are there to breaking down the ROI computation into two separate elements, margin and turnover?
2. Fill in the missing information above, and comment on the relative performance of the three companies in as much detail as the data permit. Make spec (tic recommendations about how to improve the ROI (Adapted from National Association of Accountants, Research Report No. 35, p. 34)
1)
Return on Investment (ROI), Margin and Turnover:
Return on Investment is calculated as Margin divided by Turnover. Here Margin refers to the Sales Margin and Turnover refers to the Capital Turnover Ratio.
Return on Investment calculations are important from a business standpoint as they help in evaluation of new investment proposals, make or buy decisions, capital expenditure projects and whether to invest in a particular company or not.
Advantages of breaking down Return on Investment computation into Margin and Turnover in ROI Calculations.
Answer to Problem 17P
Solution:
Advantages of breaking down Return on Investment computation into Margin and Turnover in ROI Calculations are as follows:
- It provides Detailed Informationof profits earned from capital expenditure
- It serves as a Measure of efficiencyand analysis of performance.
Explanation of Solution
- Margin is the percentage of Profit earned by an entity in a given reporting period. Profit is calculated as Revenues less Cost of Goods Sold and Indirect Expenses.
- Margin is Profit expressed in terms of Sales as a percentage.
- For example, if a company has Sales of $500 Million during a given year, and Profit is $50 Million during that period, then the Margin would be 10%
- Turnover is the capital turnover ratio. This is calculated by dividing the Sales (Turnover) for the reporting period by the entity’s capital for the year.
- For example, if a company has Sales of $500 Million during a given year, and Capital is $2500 Million during that period, then the Capital Turnover Ratio would be 10%
- Hence if the above figures of Margin and Turnover are considered, the Return on Investment, which is calculated as Margin divided by turnover, would be 50%
- Detailed information :Breaking down Return on Investment into margin and turnover elements helps in analyzing the following:
- How an investment is performing compared to the overall market conditions,
- Whether it matches up to the yardstick of the target returns expected at the time of investment,
- Whether returns are in line with predetermined industry standards and comparable investments etc.
- Measure of Efficiency :Breaking down Return on Investment into margin and turnover elements acts as a measure of efficiency in the following ways
- It helps in analyzing the returns from expenses incurred by the entity and allows for cost benefit analysis
- It enables those in charge of financial decision making of an entity to take advantage of investment opportunities by providing a tool for analysis of parameters
- It can also act as an incentive to promote healthy performance by financial decision makers such as managers by linking their incentives to achieving return on investment goals.
Hence the advantages of Breaking down Return on Investment into margin and turnover elements are enumerated.
2)
Return on Investment (ROI)
Return on Investment is calculated as Margin divided by Turnover. Here Margin refers to the Sales Margin and Turnover refers to the Capital Turnover Ratio
Capital Turnover ratio is calculated by dividing the Sales by the average operating assets for the year.
Average operating assets are the average of the balances of the total assets required to run operations of a business. Operating assets consist of both current and fixed assets.
Average of balances of such assets for the current and immediately preceding period is considered for Average operating assets.
Fill up incomplete table and make recommendations about the improvement of return on investment.
Answer to Problem 17P
Solution:
- The table is completed as follows:
| Company | |||
| Particulars | A | B | C |
| Sales | $ 600,000 | $ 500,000 | $ 500,000 |
| Net Operating Income | $ 84,000 | $ 70,000 | $ 17,500 |
| Average Operating Assets | $ 300,000 | $ 250,000 | $ 1,000,000 |
| Margin | 14.00% | 14.00% | 3.50% |
| Turnover | 0.5 | 2 | 2 |
| ROI | 28.00% | 7.00% | 1.75% |
- Recommendations to improve Return on Investment:
- Increase Revenues
- Decrease Costs
Explanation of Solution
- Margin is the percentage of Profit earned by an entity in a given reporting period. Profit is calculated as Revenues less Cost of Goods Sold and Indirect Expenses.
- Margin is Profit expressed in terms of Sales as a percentage.
- Turnover is the capital turnover ratio. This is calculated by dividing the sales by the average operating assets for the year.
- Return on Investment is calculated as Margin divided by Turnover.
- Return on Investment calculations are important from a business standpoint as they help in evaluation of new investment proposals, make or buy decisions, capital expenditure projects and whether to invest in a particular company or not.
- Given:
| Company | |||
| Particulars | A | B | C |
| Sales | $ 600,000 | $ 500,000 | ? |
| Net Operating Income | $ 84,000 | $ 70,000 | ? |
| Average Operating Assets | $ 300,000 | ? | $ 1,000,000 |
| Margin | ? | ? | 3.50% |
| Turnover | ? | ? | 2 |
| ROI | ? | 7.00% | ? |
- Formulae used:
- Calculations:
Company A:
Margin = 14.00%
Turnover = 300000 / 600000
Turnover = 0.5
Return on Investment = 28%
Company B:
Company C:
- Recommendations:
Increase Revenues:
It is imperative to increase the revenues by aggressively expanding and diversifying sales geographies and try to expand market share.
Competition needs to be analyzed and methods to providing greater value to customers without harming existing profits need to be innovated in order to ensure that there is sufficient year on year growth.
Decrease Costs:
Reduction of direct and indirect costs by implementing quality and performance improvement initiatives, reduction of wasteful expenses that reduce incomes etc. must be ensured.
Reduction of average operating assets of a business without reducing the sales is also a mandate to improve return on investment.
Hence the table is completed and recommendations to improve Return on Investment are given.
Want to see more full solutions like this?
Chapter 10 Solutions
Introduction To Managerial Accounting


- 72 Inc. has developed a balanced scorecard with the following performance metrics: Total sales Employee turnover Market share Number of shipping errors Median training hours per employee Number of new customers Relative to the metric customer satisfaction ratings, which of these performance metrics are leading indicators and which are lagging indicators?arrow_forwardThe following Box Scorecard was prepared for a value stream: Required: 1. How many nonfinancial measures are used to evaluate performance? Why are nonfinancial measures used? 2. Classify the operational measures as time-based, quality-based, or efficiency-based. Discuss the significance of each category for lean manufacturing. 3. What is the role of the Planned Future State column? 4. Discuss the capacity category and explain the meaning of each measure and its significance. 5. Discuss the relationship between the financial measures and the measures in the operational and capacity categories.arrow_forwardConsider the following list of scorecard measures: a. Product profitability b. Ratings from customer surveys c. Number of patents pending d. Strategic job coverage ratio e. Revenue per employee f. Quality costs g. Percentage of market h. Employee turnover percentages i. First-pass yields j. On-time delivery percentage k. Percentage of revenues from new sources l. Economic value added Required: Classify each measure according to the following: perspective, financial or nonfinancial, subjective or objective, and external or internal. When the perspective is process, identify which type of process: innovation, operations, or post-sales service.arrow_forward
- A Box Scorecard was prepared for a value stream: Required: 1. How many nonfinancial measures are used to evaluate performance? Why are nonfinancial measures used? 2. Classify the operational measures as time-based, quality-based, or efficiency-based. Discuss the significance of each category for lean manufacturing. 3. What is the role of the Planned Future State column? 4. Discuss the capacity category and explain the meaning of each measure and its significance. 5. Discuss the relationship between the financial measures and the measures in the operational and capacity categories.arrow_forwardAs manager of department B in MarIeys Manufacturing, based on the costs you identified in the previous exercise for further research, how does this impact the financial performance of your department, and what might be some questions you want to ask or solutions you might propose to Marleys management?arrow_forwardEvaluate the two departments for Moxie Products. Compare the years performance of the two departments in terms of ROI and RI. Which department has created the most wealth for Moxie shareholders in the past year?arrow_forward
- The following if-then statements were taken from a Balanced Scorecard: a. If employee capabilities increase, then process time decreases. b. If process time decreases, then customer retention will increase. c. If customer retention increases, then market share will increase. d. If market share increases, then revenues will increase. Required: 1. Identify the lead and lag variables, and explain your reasoning. 2. Discuss the implications of Requirement 1 for the financial and learning and growth perspectives. 3. Using the first if-then statement, explain the concept of double-loop feedback.arrow_forwardEye Swear Inc. has a balanced scorecard that includes the following relationships: Actual results for this year and last year are as follows: Instructions 1.Analyze these statistics to verify whether they support the expected relationships between the strategic objectives and performance metrics. 2.Identify three possible reasons for any unsupported relationship you identified in part (1). 3.Which of the three possibilities you identified in part (2) is the most likely reason for the unsupported relationship you identified in part (1)?arrow_forwardPrepare a balanced scorecard for Delhi Dairies, without numbers, which will help them to achieve their strategy and to maximize long-term shareholder value. (Give at least two performance measures for each category.)arrow_forward
- Classify each of the following performance measures into the balanced scorecard perspective to which it relates: financial perspective, internal operations perspective, learning and growth perspective, or customer perspective. A. Employee satisfaction surveys B. Units of waste per production process, uniformity of products and inventory control C. Number of energy-efficient bulbs replaced D. Management training course certificates awarded E. Divisional profit F. Number of customer referralsarrow_forwardHyperflash Inc. has a balanced scorecard that includes the following relationships: Actual results for this month and last month are as follows: Instructions 1.Analyze these data to verify whether they support the expected relationship between the strategic objectives and performance metrics. 2.Identify three possible reasons for any unsupported relationship you identified in part (1). 3.Which of the three possibilities you identified in part (2) is the most likely reason for the unsupported relationship you identified in part (1)?arrow_forwardInstructions 1.Based on the balanced scorecard and the following descriptions of the predicted relationships between strategic objectives, draw the scorecards strategy map. a.Training employees effectively and reducing employee turnover can both be expected to improve returns processing and reduce shipping errors. b.Both improving returns processing and reducing shipping errors can be expected to delight the customer. c.Delighting the customer can be expected to increase market share. 2.Based on the balanced scorecard and the following descriptions of the predicted relationships between performance metrics, draw the scorecards measure map. a.Median training hours per employee and average employee tenure will both influence hours from returned to refunded and number of erroneous shipments. b.Both hours from returned to refunded and number of erroneous shipments will affect percentage of customers who shop again and online customer satisfaction rating. c.Both percentage of customers who shop again and online customer satisfaction rating will influence the companys market share. 3.Label each element of the balanced scorecard.arrow_forward
 Managerial AccountingAccountingISBN:9781337912020Author:Carl Warren, Ph.d. Cma William B. TaylerPublisher:South-Western College Pub
 Principles of Accounting Volume 2AccountingISBN:9781947172609Author:OpenStaxPublisher:OpenStax College
 Principles of Cost AccountingAccountingISBN:9781305087408Author:Edward J. Vanderbeck, Maria R. MitchellPublisher:Cengage Learning
 Cornerstones of Cost Management (Cornerstones Ser...AccountingISBN:9781305970663Author:Don R. Hansen, Maryanne M. MowenPublisher:Cengage Learning
 Financial And Managerial AccountingAccountingISBN:9781337902663Author:WARREN, Carl S.Publisher:Cengage Learning,
 EBK CONTEMPORARY FINANCIAL MANAGEMENTFinanceISBN:9781337514835Author:MOYERPublisher:CENGAGE LEARNING - CONSIGNMENT