
Concept explainers
Videos
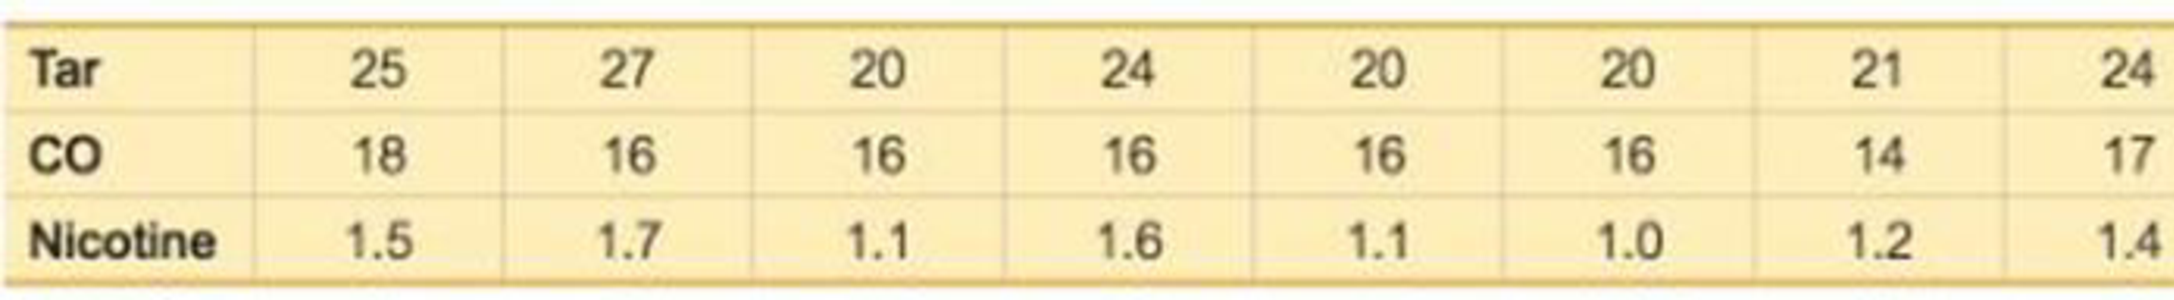
Cigarette Tar and Nicotine The table below lists measured amounts (mg) of tar, carbon monoxide (CO), and nicotine in king size cigarettes of different brands (from Data Set 13 “Cigarette Contents” in Appendix B).
a. Is there is sufficient evidence to support a claim of a
b. What percentage of the variation in nicotine can be explained by the linear correlation between nicotine and tar?
c. Letting y represent the amount of nicotine and letting x represent the amount of tar, identify the regression equation.
d. The Raleigh brand king size cigarette is not included in the table, and it has 23 mg of tar. What is the best predicted amount of nicotine? How does the predicted amount compare to the actual amount of 1.3 mg of nicotine?
Want to see the full answer?
Check out a sample textbook solution
Chapter 10 Solutions
Essentials of Statistics (6th Edition)


 Glencoe Algebra 1, Student Edition, 9780079039897...AlgebraISBN:9780079039897Author:CarterPublisher:McGraw Hill
 Big Ideas Math A Bridge To Success Algebra 1: Stu...AlgebraISBN:9781680331141Author:HOUGHTON MIFFLIN HARCOURTPublisher:Houghton Mifflin Harcourt