
Essentials of Statistics (6th Edition)
6th Edition
ISBN: 9780134685779
Author: Mario F. Triola
Publisher: PEARSON
expand_more
expand_more
format_list_bulleted
Concept explainers
Videos
Textbook Question
Chapter 10, Problem 5CQQ
The following exercises are based on the following sample data consisting of numbers of enrolled students (in thousands) and numbers of burglaries for randomly selected large colleges in a recent year (based on data from the New York Times).
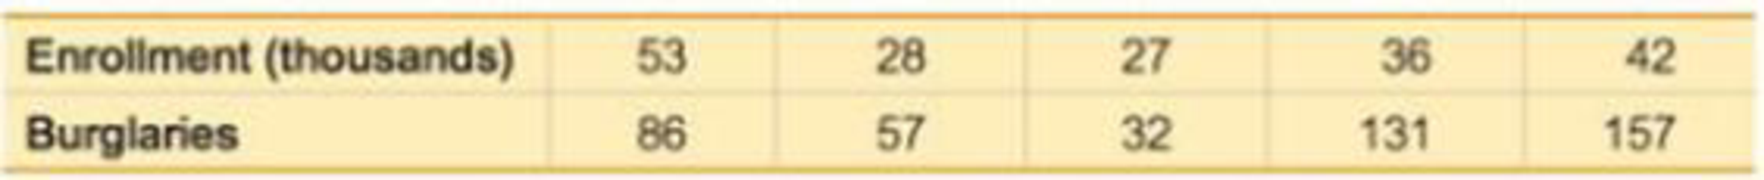
5. Predictions The sample data result in a linear
Expert Solution & Answer
Want to see the full answer?
Check out a sample textbook solution
Students have asked these similar questions
After performing a statistical regression on a set of data the value of the correlation coefficient r was -0.2041. What does that imply about the data?
on the basis of the value of linear correlation coefficient, would you conclude, at the /r/>0.9 level, that the data can be reasonably modeled linear equation?
The table below gives the age and bone density for five randomly selected women. Using this data, consider the equation of the regression line, yˆ=b0+b1^x, for predicting a woman's bone density based on her age. Keep in mind, the correlation coefficient may or may not be statistically significant for the data given. Remember, in practice, it would not be appropriate to use the regression line to make a prediction if the correlation coefficient is not statistically significant.
Age Bone Density35 35043 34053 33954 32155 310
Step 4 of 6 :
Determine the value of the dependent variable yˆ at x=0.
Chapter 10 Solutions
Essentials of Statistics (6th Edition)
Ch. 10.1 - Notation Twenty different statistics students are...Ch. 10.1 - Interpreting r For the some two variables...Ch. 10.1 - Global Warming If we find that there is a linear...Ch. 10.1 - Scatterplots Match these values of r with the five...Ch. 10.1 - Bear Weight and Chest Size Fifty-four wild bears...Ch. 10.1 - Casino Size and Revenue The New York Times...Ch. 10.1 - Garbage Data Set 31 Garbage Weight in Appendix B...Ch. 10.1 - Cereal Killers The amounts of sugar (grams of...Ch. 10.1 - Explore! Exercises 9 and 10 provide two data sets...Ch. 10.1 - Explore! Exercises 9 and 10 provide two data sets...
Ch. 10.1 - Outlier Refer to the accompanying...Ch. 10.1 - Clusters Refer to the following Minitab-generated...Ch. 10.1 - Testing for a Linear Correlation. In Exercises...Ch. 10.1 - Testing for a Linear Correlation. In Exercises...Ch. 10.1 - Testing for a Linear Correlation. In Exercises...Ch. 10.1 - Testing for a Linear Correlation. In Exercises...Ch. 10.1 - Testing for a Linear Correlation. In Exercises...Ch. 10.1 - Testing for a Linear Correlation. In Exercises...Ch. 10.1 - Testing for a Linear Correlation. In Exercises...Ch. 10.1 - Testing for a Linear Correlation. In Exercises...Ch. 10.1 - Testing for a Linear Correlation. In Exercises...Ch. 10.1 - Testing for a Linear Correlation. In Exercises...Ch. 10.1 - Testing for a Linear Correlation. In Exercises...Ch. 10.1 - Testing for a Linear Correlation. In Exercises...Ch. 10.1 - Testing for a Linear Correlation. In Exercises...Ch. 10.1 - Testing for a Linear Correlation. In Exercises...Ch. 10.1 - Testing for a Linear Correlation. In Exercises...Ch. 10.1 - Testing for a Linear Correlation. In Exercises...Ch. 10.1 - Transformed Data In addition to testing for a...Ch. 10.1 - Finding Critical r Values Table A-6 lists critical...Ch. 10.2 - Notation Different hotels on Las Vegas Boulevard...Ch. 10.2 - Notation What is the difference between the...Ch. 10.2 - Best-Fit Line a. What is a residual? b. In what...Ch. 10.2 - Correlation and Slope What is the relationship...Ch. 10.2 - Making Predictions. In Exercises 58, let the...Ch. 10.2 - Making Predictions. In Exercises 58, let the...Ch. 10.2 - Making Predictions. In Exercises 58, let the...Ch. 10.2 - Making Predictions. In Exercises 58, let the...Ch. 10.2 - Finding the Equation of the Regression Line. In...Ch. 10.2 - Finding the Equation of the Regression Line. In...Ch. 10.2 - Effects of an Outlier Refer to the Mini...Ch. 10.2 - Effects of Clusters Refer to the Minitab-generated...Ch. 10.2 - Regression and Predictions. Exercises 1328 use the...Ch. 10.2 - Regression and Predictions. Exercises 1328 use the...Ch. 10.2 - Regression and Predictions. Exercises 1328 use the...Ch. 10.2 - Regression and Predictions. Exercises 1328 use the...Ch. 10.2 - Regression and Predictions. Exercises 1328 use the...Ch. 10.2 - Regression and Predictions. Exercises 1328 use the...Ch. 10.2 - Regression and Predictions. Exercises 1328 use the...Ch. 10.2 - Regression and Predictions. Exercises 1328 use the...Ch. 10.2 - Regression and Predictions. Exercises 1328 use the...Ch. 10.2 - Regression and Predictions. Exercises 1328 use the...Ch. 10.2 - Regression and Predictions. Exercises 1328 use the...Ch. 10.2 - Regression and Predictions. Exercises 1328 use the...Ch. 10.2 - Regression and Predictions. Exercises 13-28 use...Ch. 10.2 - Regression and Predictions. Exercises 13-28 use...Ch. 10.2 - Regression and Predictions. Exercises 13-28 use...Ch. 10.2 - Regression and Predictions. Exercises 13-28 use...Ch. 10.2 - Least-Squares Property According to the...Ch. 10.3 - Regression If the methods of this section are used...Ch. 10.3 - Level of Measurement Which of the levels of...Ch. 10.3 - Notation What do r, rs , and ps denote? Why is the...Ch. 10.3 -
4. Efficiency The efficiency of the rank...Ch. 10.3 - In Exercises 5 and 6, use the scatterplot to find...Ch. 10.3 - In Exercises 5 and 6, use the scatterplot to find...Ch. 10.3 - Testing for Rank Correlation. In Exercises 712,...Ch. 10.3 - Prob. 8BSCCh. 10.3 - Testing for Rank Correlation. In Exercises 712,...Ch. 10.3 - Testing for Rank Correlation. In Exercises 712,...Ch. 10.3 - Prob. 11BSCCh. 10.3 - Testing for Rank Correlation. In Exercises 712,...Ch. 10.3 - Prob. 13BSCCh. 10.3 - Appendix B Data Sets. In Exercises 1316, use the...Ch. 10.3 - Appendix B Data Sets. In Exercises 1316, use the...Ch. 10.3 - Prob. 16BSCCh. 10.3 - Prob. 17BBCh. 10 - The following exercises are based on the following...Ch. 10 - The following exercises are based on the following...Ch. 10 - The following exercises are based on the following...Ch. 10 - The following exercises are based on the following...Ch. 10 - The following exercises are based on the following...Ch. 10 - The following exercises are based on the following...Ch. 10 - The following exercises are based on the following...Ch. 10 - The following exercises are based on the following...Ch. 10 - The following exercises are based on the following...Ch. 10 - Interpreting Scatterplot If the sample data were...Ch. 10 - Cigarette Tar and Nicotine The table below lists...Ch. 10 - 2. Cigarette Nicotine and Carbon Monoxide Refer to...Ch. 10 - Time and Motion In a physics experiment at Doane...Ch. 10 - Stocks and Sunspots. Listed below are annual high...Ch. 10 - Stocks and Sunspots. Listed below are annual high...Ch. 10 - Stocks and Sunspots. Listed below are annual high...Ch. 10 - Stocks and Sunspots. Listed below are annual high...Ch. 10 - Stocks and Sunspots. Listed below are annual high...Ch. 10 - Cell Phones and Driving In the authors home town...Ch. 10 - Ages of Moviegoers The table below shows the...Ch. 10 - Ages of Moviegoers Based on the data from...Ch. 10 - Speed Dating Data Set 18 Speed Dating" in Appendix...Ch. 10 - Speed Dating Data Set 18 Speed Dating" in Appendix...Ch. 10 - Speed Dating Data Set 18 Speed Dating" in Appendix...Ch. 10 - Speed Dating Data Set 18 Speed Dating in Appendix...Ch. 10 - Speed Dating Data Set 18 Speed Dating in Appendix...Ch. 10 - Critical Thinking: Is the pain medicine Duragesic...Ch. 10 - Critical Thinking: Is the pain medicine Duragesic...Ch. 10 - Critical Thinking: Is the pain medicine Duragesic...Ch. 10 - Critical Thinking: Is the pain medicine Duragesic...Ch. 10 - Critical Thinking: Is the pain medicine Duragesic...Ch. 10 - Prob. 4RE
Knowledge Booster


Learn more about
Need a deep-dive on the concept behind this application? Look no further. Learn more about this topic, statistics and related others by exploring similar questions and additional content below.Similar questions
- For the following exercises, consider the data in Table 5, which shows the percent of unemployed in a city ofpeople25 years or older who are college graduates is given below, by year. 41. Based on the set of data given in Table 7, calculatethe regression line using a calculator or othertechnology tool, and determine the correlationcoefficient to three decimal places.arrow_forwardThe table below gives the age and bone density for five randomly selected women. Using this data, consider the equation of the regression line, yˆ=b0+b1^x, for predicting a woman's bone density based on her age. Keep in mind, the correlation coefficient may or may not be statistically significant for the data given. Remember, in practice, it would not be appropriate to use the regression line to make a prediction if the correlation coefficient is not statistically significant. Age Bone Density35 35043 34053 33954 32155 310 Step 1 of 6 : Find the estimated slope. Round your answer to three decimal places.arrow_forwardThe table below gives the age and bone density for five randomly selected women. Using this data, consider the equation of the regression line, yˆ=b0+b1^x, for predicting a woman's bone density based on her age. Keep in mind, the correlation coefficient may or may not be statistically significant for the data given. Remember, in practice, it would not be appropriate to use the regression line to make a prediction if the correlation coefficient is not statistically significant. Age Bone Density35 35043 34053 33954 32155 310 Step 3 of 6 : Determine if the statement "Not all points predicted by the linear model fall on the same line" is true or false.arrow_forward
- The table below gives the age and bone density for five randomly selected women. Using this data, consider the equation of the regression line, yˆ=b0+b1^x, for predicting a woman's bone density based on her age. Keep in mind, the correlation coefficient may or may not be statistically significant for the data given. Remember, in practice, it would not be appropriate to use the regression line to make a prediction if the correlation coefficient is not statistically significant. Age Bone Density35 35043 34053 33954 32155 310 Step 2 of 6 : Find the estimated y-intercept. Round your answer to three decimal places.arrow_forwardSuppose the following data were collected from a sample of 15 houses relating selling price to square footage and the architectural style of the house. Use statistical software to find the following regression equation: PRICEi=b0+b1SQFTi+b2COLONIALi+b3RANCHi+ei . Is there enough evidence to support the claim that on average, houses that are ranch style have lower selling prices than houses that are Victorian style at the 0.05 level of significance? If yes, write the regression equation in the spaces provided with answers rounded to two decimal places. Else, select "There is not enough evidence."Selling Price Square Footage Colonial (1 if house is Colonial style, 0 otherwise) Ranch (1 if house is Ranch style, 0 otherwise) Victorian (1 if house is Victorian style, 0 otherwise) 377640 1941 1 0 0 460996 3397 0 1 0 405781 2764 0 0 1 407216 2906 0 0 1 435139 3401 1 0 0 405275 2600 0 0 1 381141 2203 0 1 0 370490 2046 1 0 0 404070 2210 0 0 1 460196 3692 0 1 0 382780 2172 1 0 0 406466 2606 0 1…arrow_forwardThe table below gives the age and bone density for five randomly selected women. Using this data, consider the equation of the regression line, yˆ=b0+b1x, for predicting a woman's bone density based on her age. Keep in mind, the correlation coefficient may or may not be statistically significant for the data given. Remember, in practice, it would not be appropriate to use the regression line to make a prediction if the correlation coefficient is not statistically significant. Age Bone Density48 35151 32056 31860 31169 310 Step 6 of 6: Find the value of the coefficient of determination. Round your answer to three decimal places.arrow_forward
- The table below gives the list price and the number of bids received for five randomly selected items sold through online auctions. Using this data, consider the equation of the regression line, yˆ=b0+b1x, for predicting the number of bids an item will receive based on the list price. Keep in mind, the correlation coefficient may or may not be statistically significant for the data given. Remember, in practice, it would not be appropriate to use the regression line to make a prediction if the correlation coefficient is not statistically significant. Price in Dollars 24 28 34 40 43 Number of Bids 2 4 6 8 10 Find the estimated slope. Round your answer to three decimal places.arrow_forwardThe table below gives the list price and the number of bids received for five randomly selected items sold through online auctions. Using this data, consider the equation of the regression line, yˆ=b0+b1x, for predicting the number of bids an item will receive based on the list price. Keep in mind, the correlation coefficient may or may not be statistically significant for the data given. Remember, in practice, it would not be appropriate to use the regression line to make a prediction if the correlation coefficient is not statistically significant. Price in Dollars 124 143 158 160 196 Number of Bids 12 13 15 16 20 Table Step 1 of 6 : Find the estimated slope. Round your answer to three decimal places.arrow_forward
arrow_back_ios
arrow_forward_ios
Recommended textbooks for you

 Glencoe Algebra 1, Student Edition, 9780079039897...AlgebraISBN:9780079039897Author:CarterPublisher:McGraw Hill
 Big Ideas Math A Bridge To Success Algebra 1: Stu...AlgebraISBN:9781680331141Author:HOUGHTON MIFFLIN HARCOURTPublisher:Houghton Mifflin Harcourt
Glencoe Algebra 1, Student Edition, 9780079039897...
Algebra
ISBN:9780079039897
Author:Carter
Publisher:McGraw Hill
Big Ideas Math A Bridge To Success Algebra 1: Stu...
Algebra
ISBN:9781680331141
Author:HOUGHTON MIFFLIN HARCOURT
Publisher:Houghton Mifflin Harcourt
Correlation Vs Regression: Difference Between them with definition & Comparison Chart; Author: Key Differences;https://www.youtube.com/watch?v=Ou2QGSJVd0U;License: Standard YouTube License, CC-BY
Correlation and Regression: Concepts with Illustrative examples; Author: LEARN & APPLY : Lean and Six Sigma;https://www.youtube.com/watch?v=xTpHD5WLuoA;License: Standard YouTube License, CC-BY