
Concept explainers
Videos
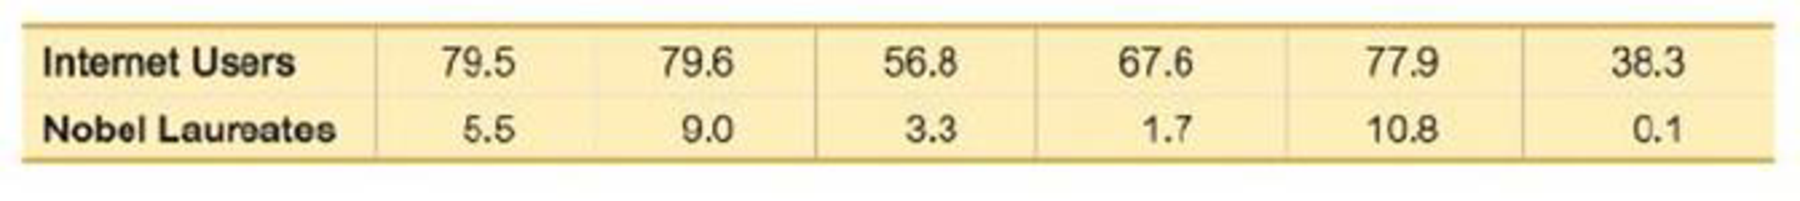
Regression and Predictions. Exercises 13–28 use the same data sets as Exercises 13–28 in Section 10-1. In each case, find the regression equation, letting the first variable be the predictor (x) variable, hind the indicated predicted value by following the prediction procedure summarized in Figure 10-5 on page 493.
13. Internet and Nobel Laureates Find the best predicted Nobel Laureate rate for Japan, which has 79.1 Internet users per 100 people. How does it compare to Japan’s Nobel Laureate rate of 1.5 per 10 million people?

Learn your wayIncludes step-by-step video

Chapter 10 Solutions
Essentials of Statistics (6th Edition)
Additional Math Textbook Solutions
Elementary Statistics: Picturing the World (6th Edition)
An Introduction to Mathematical Statistics and Its Applications (6th Edition)
Statistical Reasoning for Everyday Life (5th Edition)
Intro Stats
Intro Stats, Books a la Carte Edition (5th Edition)


- Regression and Predictions. Exercises 13–28 use the same data sets as Exercises 13–28 in Section 10-1. In each case, find the regression equation, letting the first variable be the predictor (x) variable. Find the indicated predicted value by following the prediction procedure summarized in Figure 10-5 on page 493. Internet and Nobel Laureates Find the best predicted Nobel Laureate rate for Japan, which has 79.1 Internet users per 100 people. How does it compare to Japan’s Nobel Laureate rate of 1.5 per 10 million people?arrow_forwardIf the general linear regression model is given by the equation: y = a + b?; considering the informationobtained in Figure 2 above, compute the value of a.arrow_forwardChapter 5, Section 1, Exercise 019 MORE BENEFITS OF EATING ORGANICUsing specific data, we find a significant difference in the proportion of fruit flies surviving after 13 days between those eating organic potatoes and those eating conventional (not organic) potatoes. This exercise asks you to conduct a hypothesis test using additional data. In this case, we are testing H0 : po= pcHa: po > pc where po and pc represent the proportion of fruit flies alive at the end of the given time frame of those eating organic food and those eating conventional food, respectively. Use a 5% significance level.Effect of Organic Bananas After 25 DaysAfter 25 days, the proportion of fruit flies eating organic bananas still alive is 0.42, while the proportion still alive eating conventional bananas is 0.40. The standard error for the difference in proportions is 0.029.What is the value of the test statistic?Round your answer to two decimal places. z= What is the p-value?Round your answer to…arrow_forward
- Regression and Predictions. Exercises 13–28 use the same data sets as Exercises 13–28 in Section 10-1. In each case, find the regression equation, letting the first variable be the predictor (x) variable. Find the indicated predicted value by following the prediction procedure summarized in Figure 10-5 on page 493. Old Faithful Using the listed duration and interval after times, find the best predicted “interval after” time for an eruption with a duration of 253 seconds. How does it compare to an actual eruption with a duration of 253 seconds and an interval after time of 83 minutes?arrow_forwardSection 10.2 Question #8 Find the regression equation, letting the first variable be the predictor (x) variable. Using the listed lemon/crash data, where lemon imports are in metric tons and the fatality rates are per 100,000 people, find the best predicted crash fatality rate for a year in which there are 450metric tons of lemon imports. Is the prediction worthwhile? Lemon Imports 226 270 364 488 525 Crash Fatality Rate 16.1 15.9 15.6 15.5 15.1 Find the equation of the regression line. y= ___________+( ____________)x (Round the y-intercept to three decimal places as needed. Round the slope to four decimal places as needed.) The best predicted crash fatality rate for a year in which there are 450 metric tons of lemon imports is _________ fatalities per 100,000 population. (Round to one decimal place as needed.)arrow_forwardFit a multiple linear regression model to the given data. as X1,X2,X5, and X6 as regressors.arrow_forward
- Chapter 9, Section 1, Exercise 006 Computer output for fitting a simple linear model is given below. State the value of the sample slope for this model and give the null and alternative hypotheses for testing if the slope in the population is different from zero. Identify the p-value and use it (and a 5% significance level) to make a clear conclusion about the effectiveness of the model.The regression equation is Y=81.0-0.0155X. Predictor Coef SE Coef T P Constant 80.96 11.62 6.97 0.000 X -0.01546 0.01288 -1.20 0.245arrow_forward2.state each of the five assumptions of the classical regression model (OLS) and give an intuitive explanation of the meaning and need for each of themarrow_forwardIn Australia, 16% of the adult population is nearsighted.17 If three Australians are chosen at random, what is the probability that two are nearsighted and one is not? 2.state each of the five assumptions of the classical regression model (OLS) and give an intuitive explanation of the meaning and need for each of them.arrow_forward
- For the regression model Yi = b0 + eI, derive the least squares estimator.arrow_forwardSection 10.2 Question #5 Use the given data to find the equation of the regression line. Examine the scatterplot and identify a characteristic of the data that is ignored by the regression line. x 7 10 8 9 12 14 13 5 11 6 4 y 8.11 10.67 9.27 10.12 10.86 9.82 10.49 4.89 10.91 6.66 2.82 y= ____________+ _____________x (Round to two decimal places as needed.)arrow_forwardChapter 6, Section 4-D, Exercise 181 Use the formula to find the standard error of the distribution of differences in sample means, x¯1-x¯2.Samples of size 26 from Population 1 with mean 6.6 and standard deviation 4.0 and samples of size 44 from Population 2 with mean 8.5 and standard deviation 7.4Round your answer for the standard error to two decimal places.standard errorarrow_forward
 MATLAB: An Introduction with ApplicationsStatisticsISBN:9781119256830Author:Amos GilatPublisher:John Wiley & Sons Inc
 Probability and Statistics for Engineering and th...StatisticsISBN:9781305251809Author:Jay L. DevorePublisher:Cengage Learning
 Statistics for The Behavioral Sciences (MindTap C...StatisticsISBN:9781305504912Author:Frederick J Gravetter, Larry B. WallnauPublisher:Cengage Learning
 Elementary Statistics: Picturing the World (7th E...StatisticsISBN:9780134683416Author:Ron Larson, Betsy FarberPublisher:PEARSON
 The Basic Practice of StatisticsStatisticsISBN:9781319042578Author:David S. Moore, William I. Notz, Michael A. FlignerPublisher:W. H. Freeman
 Introduction to the Practice of StatisticsStatisticsISBN:9781319013387Author:David S. Moore, George P. McCabe, Bruce A. CraigPublisher:W. H. Freeman