Modern Business Statistics with Microsoft Office Excel (with XLSTAT Education Edition Printed Access Card) (MindTap Course List)
6th Edition
ISBN: 9781337115186
Author: David R. Anderson, Dennis J. Sweeney, Thomas A. Williams, Jeffrey D. Camm, James J. Cochran
Publisher: Cengage Learning
bartleby

Concept explainers

bartleby

Videos

Textbook Question
Book Icon
Chapter 10, Problem 43SE

Country Financial, a financial services company, uses surveys of adults age 18 and older to determine whether personal financial fitness is changing over time (USA Today, April 4, 2012). In February 2012, a sample of 1000 adults showed 410 indicating that their financial security was more than fair. In February 2010, a sample of 900 adults showed 315 indicating that their financial security was more than fair.

  1. a. State the hypotheses that can be used to test for a significant difference between the population proportions for the two years.
  2. b. What is the sample proportion indicating that their financial security was more than fair in 2012? In 2010?
  3. c. Conduct the hypothesis test and compute the p-value. At a .05 level of significance, what is your conclusion?
  4. d. What is the 95% confidence interval estimate of the difference between the two population proportions?

a.

Expert Solution
Check Mark
To determine

State the null and alternative hypotheses.

Answer to Problem 43SE

Null hypothesis:H0:p1p2=0

Alternative hypothesis:Ha:p1p20

Explanation of Solution

Calculation:

It is given that in February 2012, 410 out of 1,000 adults indicated that their financial security was more than fair and in February 2010, 315 out of 900 adults indicated that their financial security was more than fair.

Here, p1 represents the population proportion of adults saying that their financial security was more than fair in 2012 and p2 represents the population proportion of adults saying that their financial security was more than fair in 2010.

State the hypothesis:

Null hypothesis:

H0:p1p2=0

That is, there is no significant difference between the population proportions for the two years.

Alternative hypothesis:

Ha:p1p20

That is, there is a significant difference between the population proportions for the two years.

b.

Expert Solution
Check Mark
To determine

Find the sample proportion that indicates that their financial security was more than fair in 2012 and 2010.

Answer to Problem 43SE

The sample proportions that indicate that their financial security was more than fair in 2012 and 2010 are 0.41 and 0.35, respectively.

Explanation of Solution

Calculation:

Sample proportion for 2012:

The sample proportion for 2012 p¯1 is calculated as follows:

p¯1=x1n1=4101,000=0.41

Thus, the sample proportion for 2012 is 0.41.

Sample proportion for 2010:

The sample proportion for 2010 p¯2 is calculated as follows:

p¯2=x2n2=315900=0.35

Thus, the sample proportion for 2010 is 0.35.

c.

Expert Solution
Check Mark
To determine

Find the p-value and provide a conclusion at α=0.05 level of significance.

Answer to Problem 43SE

The p-value is 0.007.

There is sufficient evidence to conclude that there is a significant difference between the population proportions for the two years.

Explanation of Solution

Calculation:

The test statistic for the hypothesis test about p1p2 is calculated as follows:

z=(p¯1p¯2)p¯(1p¯)(1n1+1n2).

Here, p¯1 is the sample proportion for a simple random sample from population 1, p¯2 is the sample proportion for a simple random sample from population 2, p¯ is the pooled estimator of p, n1 is the sample size for population 1, n2 is the sample size for population 2, and zα2 is the critical value.

From Part (b), p¯1=0.41 and p¯2=0.35.

Pooled estimator:

p¯=n1p¯1+n2p¯2n1+n2=1,000(0.41)+900(0.35)1,000+900=410+3151,900=0.3816

Substitute p¯1 for 0.41, p¯2 for 0.35, n1 for 1,000, n2 for 900, and p¯ for 0.3816 in the z formula.

z=(0.410.35)0.3816(10.3816)(11,000+1900)=0.06(0.2360)(0.0021)=0.060.0223=2.69

Thus, the test statistic z-value is 2.69.

Software procedure:

Step-by-step procedure to obtain the probability value using Excel.

  • Open an EXCEL sheet and select the cell A1.
  • Enter the formula =NORM.S.DIST(2.69,TRUE) in the cell A1.
  • Press Enter.

The output obtained using EXCEL software is given below:

Modern Business Statistics with Microsoft Office Excel (with XLSTAT Education Edition Printed Access Card) (MindTap Course List), Chapter 10, Problem 43SE

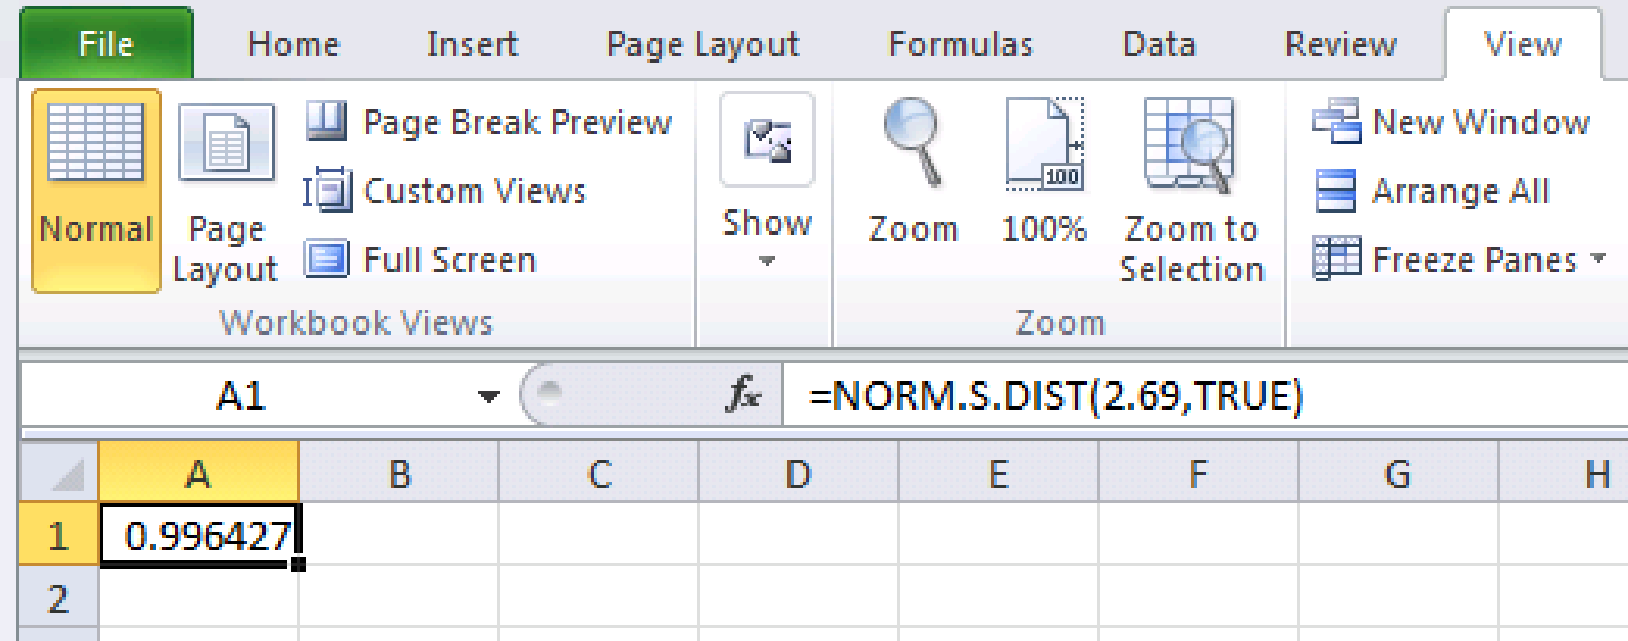
From the output, the p-value for the left tail is 0.9964.

For the upper-tail test, the p-value is (1 area to the left of 2.69), and for two-tail test, the p-value is 2×(1 area to the left of 2.69).

From the output, the result is calculated as follows:

p-value=2(10.9964)=0.007

Thus, the p-value is 0.007.

Rejection rule:

If the p-valueα, reject the null hypothesis

If the p-value>α, do not reject the null hypothesis.

Conclusion:

Here, the p-value is less than the level of significance.

That is, p-value(=0.007)α(=0.05).

From the rejection rule, the null hypothesis is rejected.

Therefore, there is sufficient evidence to conclude that there is a significant difference between the population proportions for the two years.

c.

Expert Solution
Check Mark
To determine

Obtain a 95% confidence interval for the difference between the proportions of the two populations.

Answer to Problem 43SE

The 95% confidence interval is (0.017,0.103)_.

Explanation of Solution

Calculation:

The formula for the confidence interval estimate of the difference between two populations is as follows:

p¯1p¯2±zα2p¯1(1p¯1)n1+p¯2(1p¯2)n2.

Here, p¯1 is the sample proportion for a simple random sample from population 1, p¯2 is the sample proportion for a simple random sample from population 2, n1 is the sample size for population 1, n2 is the sample size for population 2, and zα2 is the critical value.

Critical value:

For the 95% confidence level:

α=10.95=0.05α2=0.052=0.025

Hence, cumulative area to the left is calculated as follows:

Area to the left=1Area to the right=10.025=0.975

From Table II of the standard normal distribution in Appendix B, the critical value is 1.96.

Confidence interval:

The 95% confidence interval for the difference between two population proportions is obtained as shown below:

p¯1p¯2±zα2p¯1(1p¯1)n1+p¯2(1p¯2)n2=(0.410.35)±1.960.41(10.41)1,000+0.35(10.35)900=0.06±1.960.00024+0.00025=0.06±1.96(0.0221)=0.06±0.043                                                            =(0.060.043,0.06+0.043)=(0.017,0.103)

Thus, the 95% confidence interval is (0.017,0.103)_.

Interpretation:

There is 95% confidence that the population proportion of adults who say that their financial security is more than fair between 0.017 and 0.103.

Want to see more full solutions like this?

Subscribe now to access step-by-step solutions to millions of textbook problems written by subject matter experts!

Chapter 10 Solutions

Modern Business Statistics with Microsoft Office Excel (with XLSTAT Education Edition Printed Access Card) (MindTap Course List)

Ch. 10.2 - Consider the following data for two independent...Ch. 10.2 - Prob. 12ECh. 10.2 - Annual Cost of College. The increasing annual cost...Ch. 10.2 - Are nursing salaries in Tampa, Florida, lower than...Ch. 10.2 - Hotel prices worldwide are projected to increase...Ch. 10.2 - Effect of Parents’ Education on Student SAT...Ch. 10.2 - Comparing Financial Consultant Ratings....Ch. 10.2 - Researchers at Purdue University and Wichita State...Ch. 10.3 - Consider the following hypothesis test. The...Ch. 10.3 - The following data are from matched samples taken...Ch. 10.3 - Prob. 21ECh. 10.3 - The price per share of stock for a sample of 25...Ch. 10.3 - Credit Card Expenditures. Bank of America’s...Ch. 10.3 - Domestic Airfare. The Global Business Travel...Ch. 10.3 - Prob. 25ECh. 10.3 - PGA Tour Scores. Scores in the first and fourth...Ch. 10.3 - Price Comparison of Smoothie Blenders. A personal...Ch. 10.4 - Consider the following results for independent...Ch. 10.4 - Prob. 29ECh. 10.4 - Corporate Hiring Outlook. A Businessweek/Harris...Ch. 10.4 - Impact of Pinterest on Purchase Decisions. Forbes...Ch. 10.4 - Mislabeled Fish. Researchers with Oceana, a group...Ch. 10.4 - Minnesota had the highest turnout rate of any...Ch. 10.4 - Oil wells are expensive to drill, and dry wells...Ch. 10.4 - In a test of the quality of two television...Ch. 10.4 - Winter visitors are extremely important to the...Ch. 10.4 - Prob. 37ECh. 10 - Prob. 38SECh. 10 - SUV Lease Payments. Statista reports that the...Ch. 10 - Prob. 40SECh. 10 - Kitchen Versus Bedroom Remodeling Costs. The...Ch. 10 - Effect of Siblings on SAT Scores. In Born...Ch. 10 - Country Financial, a financial services company,...Ch. 10 - Prob. 44SECh. 10 - Prob. 45SECh. 10 - News Access Via Computer. The American Press...Ch. 10 - For the week ended January 15, 2009, the bullish...
Knowledge Booster
Background pattern image
Statistics
Learn more about
Need a deep-dive on the concept behind this application? Look no further. Learn more about this topic, statistics and related others by exploring similar questions and additional content below.
Recommended textbooks for you
Text book image
Holt Mcdougal Larson Pre-algebra: Student Edition...
Algebra
ISBN:9780547587776
Author:HOLT MCDOUGAL
Publisher:HOLT MCDOUGAL
Text book image
Glencoe Algebra 1, Student Edition, 9780079039897...
Algebra
ISBN:9780079039897
Author:Carter
Publisher:McGraw Hill
Text book image
College Algebra (MindTap Course List)
Algebra
ISBN:9781305652231
Author:R. David Gustafson, Jeff Hughes
Publisher:Cengage Learning
Hypothesis Testing - Solving Problems With Proportions; Author: The Organic Chemistry Tutor;https://www.youtube.com/watch?v=76VruarGn2Q;License: Standard YouTube License, CC-BY
Hypothesis Testing and Confidence Intervals (FRM Part 1 – Book 2 – Chapter 5); Author: Analystprep;https://www.youtube.com/watch?v=vth3yZIUlGQ;License: Standard YouTube License, CC-BY