
ELEMENTARY STATISTICS W/CONNECT >IP<
4th Edition
ISBN: 9781259746826
Author: Bluman
Publisher: MCG
expand_more
expand_more
format_list_bulleted
Concept explainers
Videos
Textbook Question
Chapter 10, Problem 8CTC
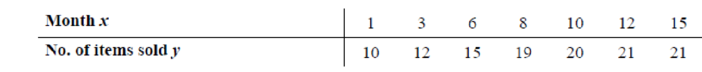
Product Sales When the points in a
8. Compute r, using the x and y values; then compute r, using the log x and y values. Which is higher?
Expert Solution & Answer
Want to see the full answer?
Check out a sample textbook solution
Chapter 10 Solutions
ELEMENTARY STATISTICS W/CONNECT >IP<
Ch. 10.1 - Stopping Distances In a study on speed control, it...Ch. 10.1 - What is meant by the statement that two variables...Ch. 10.1 - How is a linear relationship between two variables...Ch. 10.1 - What is the symbol for the sample correlation...Ch. 10.1 - What is the range of values for the correlation...Ch. 10.1 - What is meant when the relationship between the...Ch. 10.1 - Prob. 6ECh. 10.1 - What is the diagram of the independent and...Ch. 10.1 - What is the name of the correlation coefficient...Ch. 10.1 - What statistical test is used to test the...
Ch. 10.1 - When two variables are correlated, can the...Ch. 10.1 - For Exercises 11 through 27, perform the following...Ch. 10.1 - Prob. 12ECh. 10.1 - Prob. 13ECh. 10.1 - For Exercises 11 through 27, perform the following...Ch. 10.1 - For Exercises 11 through 27, perform the following...Ch. 10.1 - For Exercises 11 through 27, perform the following...Ch. 10.1 - Prob. 17ECh. 10.1 - Prob. 18ECh. 10.1 - Prob. 19ECh. 10.1 - For Exercises 11 through 27, perform the following...Ch. 10.1 - For Exercises 11 through 27, perform the following...Ch. 10.1 - For Exercises 11 through 27, perform the following...Ch. 10.1 - Prob. 23ECh. 10.1 - For Exercises 11 through 27, perform the following...Ch. 10.1 - Prob. 25ECh. 10.1 - Prob. 26ECh. 10.1 - Prob. 27ECh. 10.1 - Prob. 28ECCh. 10.1 - Prob. 29ECCh. 10.1 - Prob. 30ECCh. 10.2 - Applying the Concepts 102 Stopping Distances...Ch. 10.2 - What two things should be done before one performs...Ch. 10.2 - What are the assumptions for regression analysis?Ch. 10.2 - Prob. 3ECh. 10.2 - What is the symbol for the slope? For the y...Ch. 10.2 - Prob. 5ECh. 10.2 - When all the points fall on the regression line,...Ch. 10.2 - What is the relationship between the sign of the...Ch. 10.2 - As the value of the correlation coefficient...Ch. 10.2 - Prob. 9ECh. 10.2 - When the value of r is not significant, what value...Ch. 10.2 - For Exercises 11 through 27, use the same data as...Ch. 10.2 - Prob. 12ECh. 10.2 - For Exercises 11 through 27, use the same data as...Ch. 10.2 - For Exercises 11 through 27, use the same data as...Ch. 10.2 - For Exercises 11 through 27, use the same data as...Ch. 10.2 - For Exercises 11 through 27, use the same data as...Ch. 10.2 - Prob. 17ECh. 10.2 - Prob. 18ECh. 10.2 - Prob. 19ECh. 10.2 - For Exercises 11 through 27, use the same data as...Ch. 10.2 - For Exercises 11 through 27, use the same data as...Ch. 10.2 - For Exercises 11 through 27, use the same data as...Ch. 10.2 - For Exercises 11 through 27, use the same data as...Ch. 10.2 - For Exercises 11 through 27, use the same data as...Ch. 10.2 - Prob. 25ECh. 10.2 - Prob. 26ECh. 10.2 - For Exercises 11 through 27, use the same data as...Ch. 10.2 - Prob. 28ECh. 10.2 - Prob. 29ECh. 10.2 - For Exercises 28 through 33, do a complete...Ch. 10.2 - For Exercises 28 through 33, do a complete...Ch. 10.2 - For Exercises 28 through 33, do a complete...Ch. 10.2 - Prob. 33ECh. 10.2 - For Exercises 34 and 35, do a complete regression...Ch. 10.2 - For Exercises 34 and 35, do a complete regression...Ch. 10.2 - For Exercises 13, 15, and 21 in Section 101, find...Ch. 10.2 - Prob. 37ECCh. 10.2 - The value of the correlation coefficient can also...Ch. 10.3 - Applying the Concepts 103 Interpreting Simple...Ch. 10.3 - What is meant by the explained variation? How is...Ch. 10.3 - What is meant by the unexplained variation? How is...Ch. 10.3 - What is meant by the total variation? How is it...Ch. 10.3 - Define the coefficient of determination.Ch. 10.3 - How is the coefficient of determination found?Ch. 10.3 - Define the coefficient of nondetermination.Ch. 10.3 - How is the coefficient of nondetermination found?Ch. 10.3 - Prob. 8ECh. 10.3 - Prob. 9ECh. 10.3 - Prob. 10ECh. 10.3 - Prob. 11ECh. 10.3 - Prob. 12ECh. 10.3 - Prob. 13ECh. 10.3 - Prob. 14ECh. 10.3 - Prob. 15ECh. 10.3 - Compute the standard error of the estimate for...Ch. 10.3 - Compute the standard error of the estimate for...Ch. 10.3 - Compute the standard error of the estimate for...Ch. 10.3 - Prob. 19ECh. 10.3 - For the data in Exercises 14 in Sections 101 and...Ch. 10.3 - Prob. 21ECh. 10.3 - Prob. 22ECh. 10.4 - Applying the Concepts 104 More Math Means More...Ch. 10.4 - Explain the similarities and differences between...Ch. 10.4 - What is the general form of the multiple...Ch. 10.4 - Prob. 3ECh. 10.4 - Prob. 4ECh. 10.4 - How do the values of the individual correlation...Ch. 10.4 - Age, GPA, and Income A researcher has determined...Ch. 10.4 - Prob. 7ECh. 10.4 - Prob. 8ECh. 10.4 - Aspects of Students Academic Behavior A college...Ch. 10.4 - Age, Cholesterol, and Sodium A medical researcher...Ch. 10.4 - Explain the meaning of the multiple correlation...Ch. 10.4 - What is the range of values R can assume?Ch. 10.4 - Prob. 13ECh. 10.4 - What are the hypotheses used to test the...Ch. 10.4 - What test is used to test the significance of R?Ch. 10.4 - What is the meaning of the adjusted R2? Why is it...Ch. 10 - Prob. 10.1.1RECh. 10 - For Exercises 1 through 7, do a complete...Ch. 10 - Prob. 10.1.3RECh. 10 - For Exercises 1 through 7, do a complete...Ch. 10 - For Exercises 1 through 7, do a complete...Ch. 10 - For Exercises 1 through 7, do a complete...Ch. 10 - Prob. 10.1.7RECh. 10 - For Exercise 4, find the standard error of the...Ch. 10 - Prob. 10.2.9RECh. 10 - Prob. 10.2.10RECh. 10 - Prob. 10.2.11RECh. 10 - Prob. 10.2.12RECh. 10 - (Opt.) A study found a significant relationship...Ch. 10 - Prob. 10.2.14RECh. 10 - Prob. 10.2.15RECh. 10 - Prob. 1DACh. 10 - Prob. 2DACh. 10 - Prob. 3DACh. 10 - Prob. 1CQCh. 10 - Determine whether each statement is true or false....Ch. 10 - Determine whether each statement is true or false....Ch. 10 - Determine whether each statement is true or false....Ch. 10 - Determine whether each statement is true or false....Ch. 10 - Determine whether each statement is true or false....Ch. 10 - Prob. 7CQCh. 10 - Select the best answer. 8. To test the...Ch. 10 - Select the best answer. 9. The test of...Ch. 10 - Prob. 10CQCh. 10 - Prob. 11CQCh. 10 - Prob. 12CQCh. 10 - Complete the following statements with the best...Ch. 10 - Prob. 14CQCh. 10 - Prob. 15CQCh. 10 - Prob. 16CQCh. 10 - Prob. 17CQCh. 10 - Prob. 18CQCh. 10 - Prob. 19CQCh. 10 - Prob. 20CQCh. 10 - Prob. 21CQCh. 10 - Prob. 22CQCh. 10 - Prob. 23CQCh. 10 - For Exercise 20, find the 90% prediction interval...Ch. 10 - Prob. 25CQCh. 10 - Prob. 26CQCh. 10 - (Opt.) Find R when ryx1 = 0.561 and ryx2 = 0.714...Ch. 10 - Prob. 28CQCh. 10 - Prob. 1CTCCh. 10 - Prob. 2CTCCh. 10 - Prob. 3CTCCh. 10 - Prob. 4CTCCh. 10 - Product Sales When the points in a scatter plot...Ch. 10 - Prob. 6CTCCh. 10 - Prob. 7CTCCh. 10 - Product Sales When the points in a scatter plot...Ch. 10 - Prob. 9CTC
Knowledge Booster


Learn more about
Need a deep-dive on the concept behind this application? Look no further. Learn more about this topic, statistics and related others by exploring similar questions and additional content below.Similar questions
- Sales of a video game released in the year 2000 took off at first, but then steadily slowed as time moved on. Table 4 shows the number of games sold, in thousands, from the years 20002010. a. Let x represent time in years starting with x=1 for the year 2000. Let y represent the number of games sold in thousands. Use logarithmic regression to fit a model to these data. b. If games continue to sell at this rate, how many games will sell in 2015? Round to the nearest thousand.arrow_forwardCable TV The following table shows the number C. in millions, of basic subscribers to cable TV in the indicated year These data are from the Statistical Abstract of the United States. Year 1975 1980 1985 1990 1995 2000 C 9.8 17.5 35.4 50.5 60.6 60.6 a. Use regression to find a logistic model for these data. b. By what annual percentage would you expect the number of cable subscribers to grow in the absence of limiting factors? c. The estimated number of subscribers in 2005 was 65.3million. What light does this shed on the model you found in part a?arrow_forwardWorld Population The following table shows world population N, in billions, in the given year. Year 1950 1960 1970 1980 1990 2000 2010 N 2.56 3.04 3.71 4.45 5.29 6.09 6.85 a. Use regression to find a logistic model for world population. b. What r value do these data yield for humans on planet Earth? c. According to the logistic model using these data, what is the carrying capacity of planet Earth for humans? d. According to this model, when will world population reach 90 of carrying capacity? Round to the nearest year. Note: This represents a rather naive analysis of world population.arrow_forward
- Special Rounding Instructions When you perform logistic regression, round the r value to three decimal places and the other parameters to two decimal places. Round all answers to two decimal places unless other-wise indicated. Natural Gas Production The following table shows natural gas production N in trillions of cubic feet in the United states t years after 1940. t=yearssince1940 N=cubicft.intrilliions 0 3.75 10 8.48 20 15.09 30 23.79 40 21.87 50 21.52 60 24.15 a. Make a logistic model for N as a function of t. b. Graph the data and the logistic model. c. Which years production was farthest from the prediction of the logistic model? d. What does the logistic model predict for the amount of natural gas that will be produced in the long run? Note: In other contexts, this would be known as the carrying capacity..arrow_forwardSpecial Rounding Instructions When you perform logistic regression, round the r value to three decimal places and the other parameters to two decimal places. Round all answers to two decimal places unless other-wise indicated. An Epidemic In a city of half a million, there are initially 800 cases of a particularly virulent strain of flu. The Centers for Disease Control and Prevention in Atlanta claims that the cumulative number of infections with this flu strain will increase by 40 per week if there are no limiting factors. Make a logistic model of the potential cumulative number of cases of flu as a function of weeks from initial outbreak, and determine how long it will be before 100, 000 people are infected.arrow_forwardSpecial Rounding Instructions When you perform logistic regression, round the r value to three decimal places and the other parameters to two decimal places. Round all answers to two decimal places unless other-wise indicated. Fluorescent Bulbs Compact fluorescent light bulbs save energy when compared with traditional incandescent bulbs. Our green energy campaign includes efforts to get local residents to exchange their incandescent bulbs fur fluorescent bulbs. Initially 200 households make the change. Market studies suggest that, in the absence of limiting factors, we could increase that number by 25 each month. In our target area, there are 250,000 households, which we take as the limiting value. Make a logistic model that gives the number of households converting to fluorescent bulbs after t months.arrow_forward
- Special Rounding Instructions When you perform logistic regression, round the r value to three decimal places and the other parameters to two decimal places. Round all answers to two decimal places unless other-wise indicated. Magazine Sales Our new magazine initially sells 300 copies per month. Research indicates that a vigorous advertising campaign could increase sales by 20 each month if our market were unlimited. But research also indicates that magazine sales in our area are unlikely to exceed 1200 per month. Make a logistic model of projected magazine sales.arrow_forwardXYZ Corporation Stock Prices The following table shows the average stock price, in dollars, of XYZ Corporation in the given month. Month Stock price January 2011 43.71 February 2011 44.22 March 2011 44.44 April 2011 45.17 May 2011 45.97 a. Find the equation of the regression line. Round the regression coefficients to three decimal places. b. Plot the data points and the regression line. c. Explain in practical terms the meaning of the slope of the regression line. d. Based on the trend of the regression line, what do you predict the stock price to be in January 2012? January 2013?arrow_forwardLong-Term Data and the Carrying Capacity This is a continuation of Exercise 13. Ideally, logistic data grow toward the carrying capacity but never go beyond this limiting value. The following table shows additional data on paramecium cells. t 12 13 14 15 16 17 18 19 20 N 610 513 593 557 560 522 565 517 500 a. Add these data to the graph in part b of Exercise 13. b. Comment on the relationship of the data to the carrying capacity. Paramecium Cells The following table is adapted from a paramecium culture experiment conducted by Cause in 1934. The data show the paramecium population N as a function of time t in days. T 2 3 5 6 8 9 10 11 N 14 34 94 189 330 416 507 580 a. Use regression to find a logistic model for this population. b. Make a graph of the model you found in part a. c. According to the model you made in part a, when would the population reach 450?arrow_forward
- Special Rounding instructions When you perform logistic regression, round the r value to three decimal places and other parameters to two decimal places. Round all answers to two decimals places unless otherwise indicated. Ebola Figure 5.14 shows a plot of the total number E of Ebola cases in West Africa reported to the centers for Diseases control and Prevention from April 1, 2014, through December 1, 2015. A logistic fit for these data is given by, E=27,841.421+134.65e0.646t. Where t is the time in months since April 1, 2014. In figure 5.15, we have added the graph of this model. a.Does Figure 5.14 show a continuing epidemic or a health crisis that is under control by December 2015? b.According to the model, what was the total number of cases when the disease was spreading at the fastest rate? Round your answer to the nearest whole number. c.Use the crossing- graphs method to determine when the disease was growing at the fastest rate. Round your answer, in months, to one decimal place.arrow_forwardSpecial Rounding Instructions When you perform logistic regression, round the r value to three decimal places and the other parameters to two decimal places. Round all answers to two decimal places unless other-wise indicated. PTA Participation A school board has a plan to increase participation in the PTA. Currently only about 25 parents attend meetings. Suppose the school board plan results in logistic growth of attendance. The school board believes that its plan can eventually lead to an attendance level of 50 parents. In the absence of limiting factors, the school board believes that its plan can increase participation by 10 each month. Let m denote the number of months since the participation plan was put in place, and let P be the number of parents attending PTA meetings. a. What is the carrying capacity K for a logistic model of P versus m? b. Find the constant b for a logistic model. c. Find the r value for a logistic model. Round your answer to three decimal places. d. Find a logistic model for P versus m.arrow_forwardLife Expectancy The following table shows the average life expectancy, in years, of a child born in the given year42 Life expectancy 2005 77.6 2007 78.1 2009 78.5 2011 78.7 2013 78.8 a. Find the equation of the regression line, and explain the meaning of its slope. b. Plot the data points and the regression line. c. Explain in practical terms the meaning of the slope of the regression line. d. Based on the trend of the regression line, what do you predict as the life expectancy of a child born in 2019? e. Based on the trend of the regression line, what do you predict as the life expectancy of a child born in 1580?2300arrow_forward
arrow_back_ios
arrow_forward_ios
Recommended textbooks for you

 Functions and Change: A Modeling Approach to Coll...AlgebraISBN:9781337111348Author:Bruce Crauder, Benny Evans, Alan NoellPublisher:Cengage Learning
 Algebra & Trigonometry with Analytic GeometryAlgebraISBN:9781133382119Author:SwokowskiPublisher:Cengage
 Glencoe Algebra 1, Student Edition, 9780079039897...AlgebraISBN:9780079039897Author:CarterPublisher:McGraw Hill
Functions and Change: A Modeling Approach to Coll...
Algebra
ISBN:9781337111348
Author:Bruce Crauder, Benny Evans, Alan Noell
Publisher:Cengage Learning
Algebra & Trigonometry with Analytic Geometry
Algebra
ISBN:9781133382119
Author:Swokowski
Publisher:Cengage
Glencoe Algebra 1, Student Edition, 9780079039897...
Algebra
ISBN:9780079039897
Author:Carter
Publisher:McGraw Hill
Correlation Vs Regression: Difference Between them with definition & Comparison Chart; Author: Key Differences;https://www.youtube.com/watch?v=Ou2QGSJVd0U;License: Standard YouTube License, CC-BY
Correlation and Regression: Concepts with Illustrative examples; Author: LEARN & APPLY : Lean and Six Sigma;https://www.youtube.com/watch?v=xTpHD5WLuoA;License: Standard YouTube License, CC-BY