
Concept explainers
Videos
To explain: Whether the graphical representation of the data provided in the Figure 10.1 is best.
Answer to Problem CS
Solution: As the comparison between the age group is difficult from the pie chart by visualizing the graph, the graphical representation is not the best.
Explanation of Solution
To explain: The disadvantage of the graphical representation.
Answer to Problem CS
Solution: The disadvantage of the provided graphical representation is that the data are not compared easily.
Explanation of Solution
The better graphical representation.
Answer to Problem CS
Solution: As the data can be represented by a single side-by-side bar graph, it will be the better representation of the data.
Explanation of Solution
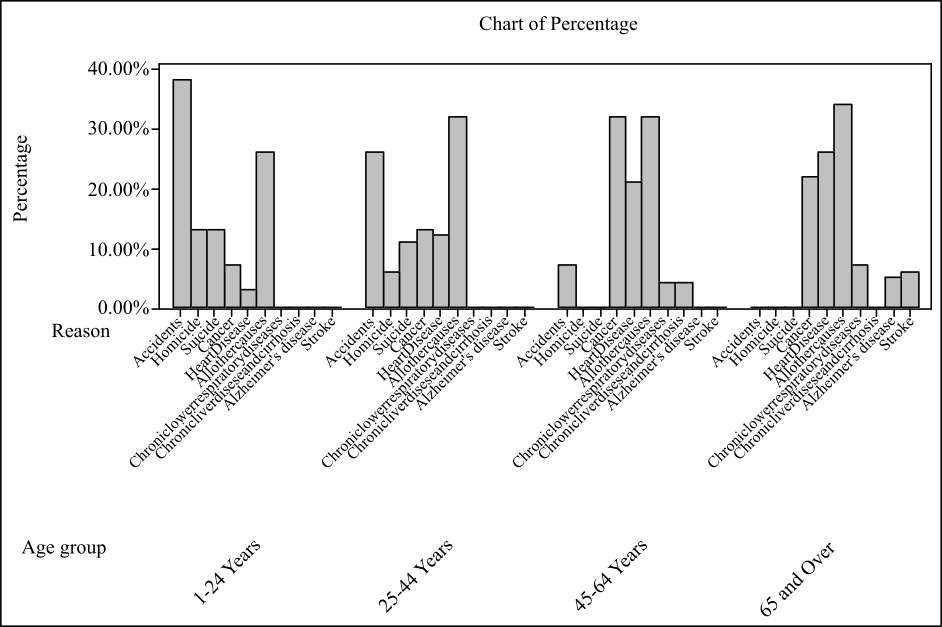
To graph: The side-by-side bar graph for the provided data set.
Explanation of Solution
Graph: To draw the required bar graph, the below steps are followed in Minitab software:
Step 1: Enter the data in Minitab worksheet.
Step 2: Go to Graph
Step 3: Select the options “Values from Table” and “Cluster”. Then, click on “OK.”
Step 4: Enter the “Graph Variables” and the “Categorical Variables”. And click on “OK.”
The obtained bar graph is shown below:
Want to see more full solutions like this?
Chapter 10 Solutions
Statistics: Concepts and Controv. (Instructor's)


 MATLAB: An Introduction with ApplicationsStatisticsISBN:9781119256830Author:Amos GilatPublisher:John Wiley & Sons Inc
 Probability and Statistics for Engineering and th...StatisticsISBN:9781305251809Author:Jay L. DevorePublisher:Cengage Learning
 Statistics for The Behavioral Sciences (MindTap C...StatisticsISBN:9781305504912Author:Frederick J Gravetter, Larry B. WallnauPublisher:Cengage Learning
 Elementary Statistics: Picturing the World (7th E...StatisticsISBN:9780134683416Author:Ron Larson, Betsy FarberPublisher:PEARSON
 The Basic Practice of StatisticsStatisticsISBN:9781319042578Author:David S. Moore, William I. Notz, Michael A. FlignerPublisher:W. H. Freeman
 Introduction to the Practice of StatisticsStatisticsISBN:9781319013387Author:David S. Moore, George P. McCabe, Bruce A. CraigPublisher:W. H. Freeman