
Concept explainers
Videos
(a)
To construct: a histogram of these 50 observations and explain about the shape.
(a)
Explanation of Solution
Given:
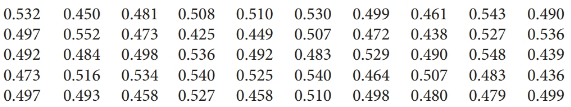
Calculation:
Table on the basis of given data of interval and frequency
| Interval | Frequency |
| 0.425-0.45 | 5 |
| 0.45-0.475 | 8 |
| 0.475-0.5 | 17 |
| 0.5-0.525 | 6 |
| 0.525-0.55 | 13 |
| 0.55-0.575 | 1 |
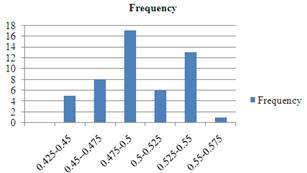
Graph:
Bar graph

By seeing that the width of the bars have to be the same and the bars have to be bounded horizontally by the interval limits. The height of the bars has to be equal the frequency.
(b)
To construct: a graph of the density curve for the population distribution and the value of the population mean.
(b)
Explanation of Solution
The histogram looking roughly Normal, because the one of highest bar is in the middle of the histogram and the histogram does not displaying any strong skewed
Graph:
Bar graph
When we randomly select a number between 0and 1, then we have a uniform distribution on (0, 1).
The mean of the uniform distribution
Chapter 10 Solutions
Statistics Through Applications
Additional Math Textbook Solutions
Statistics for Psychology
Essentials of Statistics, Books a la Carte Edition (5th Edition)
Statistical Reasoning for Everyday Life (5th Edition)
Fundamentals of Statistics (5th Edition)
Statistics: The Art and Science of Learning from Data (4th Edition)
Basic Business Statistics, Student Value Edition


 MATLAB: An Introduction with ApplicationsStatisticsISBN:9781119256830Author:Amos GilatPublisher:John Wiley & Sons Inc
 Probability and Statistics for Engineering and th...StatisticsISBN:9781305251809Author:Jay L. DevorePublisher:Cengage Learning
 Statistics for The Behavioral Sciences (MindTap C...StatisticsISBN:9781305504912Author:Frederick J Gravetter, Larry B. WallnauPublisher:Cengage Learning
 Elementary Statistics: Picturing the World (7th E...StatisticsISBN:9780134683416Author:Ron Larson, Betsy FarberPublisher:PEARSON
 The Basic Practice of StatisticsStatisticsISBN:9781319042578Author:David S. Moore, William I. Notz, Michael A. FlignerPublisher:W. H. Freeman
 Introduction to the Practice of StatisticsStatisticsISBN:9781319013387Author:David S. Moore, George P. McCabe, Bruce A. CraigPublisher:W. H. Freeman