
Concept explainers
Videos
(a)
To Explain: the sampling distribution of the mean score and sketch the density curve of this distribution.
(a)
Answer to Problem 10.37E
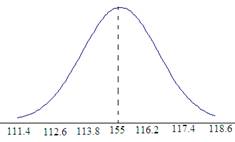
Therefore the sampling distribution of the sample mean is about normal with mean 115 and standard deviation 1.2
Explanation of Solution
Given:
Calculation:
The sampling distribution of the sample mean
The standard deviation of the sampling distribution is
Therefore the sampling distribution of the sample mean is about normal with mean 115 and standard deviation 1.2
Graph:

(b)
To Explain: in simple language that one outcome is good evidence that the mean score of all older students is greater than 115 and the other outcome is not.
(b)
Explanation of Solution
Given:
The sample mean
The sample mean
Graph:
(c)
To Explain: the area under the curve that is the p-value for the sample result.
(c)
Answer to Problem 10.37E
Area right of 118.6
Explanation of Solution
Graph:

The P-value is the probability of getting a value more extreme or equal to the sample mean
Since the alternative hypothesis claims that the mean is large than 115, the P-value is then the area containing all sample means large than the sample mean of
Chapter 10 Solutions
Statistics Through Applications
Additional Math Textbook Solutions
Fundamentals of Statistics (5th Edition)
Elementary Statistics Using Excel (6th Edition)
Statistical Reasoning for Everyday Life (5th Edition)
Elementary Statistics: Picturing the World (7th Edition)
Elementary Statistics: Picturing the World (6th Edition)


 MATLAB: An Introduction with ApplicationsStatisticsISBN:9781119256830Author:Amos GilatPublisher:John Wiley & Sons Inc
 Probability and Statistics for Engineering and th...StatisticsISBN:9781305251809Author:Jay L. DevorePublisher:Cengage Learning
 Statistics for The Behavioral Sciences (MindTap C...StatisticsISBN:9781305504912Author:Frederick J Gravetter, Larry B. WallnauPublisher:Cengage Learning
 Elementary Statistics: Picturing the World (7th E...StatisticsISBN:9780134683416Author:Ron Larson, Betsy FarberPublisher:PEARSON
 The Basic Practice of StatisticsStatisticsISBN:9781319042578Author:David S. Moore, William I. Notz, Michael A. FlignerPublisher:W. H. Freeman
 Introduction to the Practice of StatisticsStatisticsISBN:9781319013387Author:David S. Moore, George P. McCabe, Bruce A. CraigPublisher:W. H. Freeman